IEX trade ideas


IEX Wave analysisHi, all if you look at the IEX wave pattern before the bottom to bottom cycle used to be around 20 days but the whole cycle ends up being around 40+ days... And we can see that stock is making a higher high and higher low. If one can enter at the bottom of these cycle then can make a good upside. Purely for learning purpose.


IEX - Taking Muliple support at TrendLines and SupportsIEX has taken multiple times support at T/l. and Supports. Above 200 it can again do a 220... Let us see. Personally i get scared with the numbers of Tails the stock makes on every day. The weekly chart looks such huge range.
Disc - I post chart for my study purpose only. Take advise of your SEBI Registered Advisor for buying selling.


INDIAN ENERGY EXCHANGEWITH MARKED LEVELS AS STOP LOSS, CAN BE LOOKED AT FOR KNOCKING OUT THE RECENT HIGH IT MADE
**********************************************************************************************************************************************
Hi all,
Its pleasure to have you all here.
I have started putting these charts as a contribution from my side to all people who are new to business, as I had to struggle a lot without any sources at disposal. So please consider this a just small contribution from my side.
Few Honest Disclosures:
1. Any idea shared is my personal view, its not a recommendation, neither any kind of paid propaganda, so please
do your bit of research.
2. Ideas shared does not mean that I trade all or have position in them, this is just a helping hand to all.
3. I expect no comments or like nor any negativity, as I said its just a small helping hand from my side, please plan your risk and trade as per your capacity.
4. To trade in Cash, options or futures is your sole choice and your own risk
5. I am no expert in Tech Indicators, I believe in support resistance and trendline theory, you may use this as a supplement theory for better results.
6. I work for my own living, this is a hobby which I do sincerely to help anyone who might come across my charts.
***********************************************************************************************************************************************
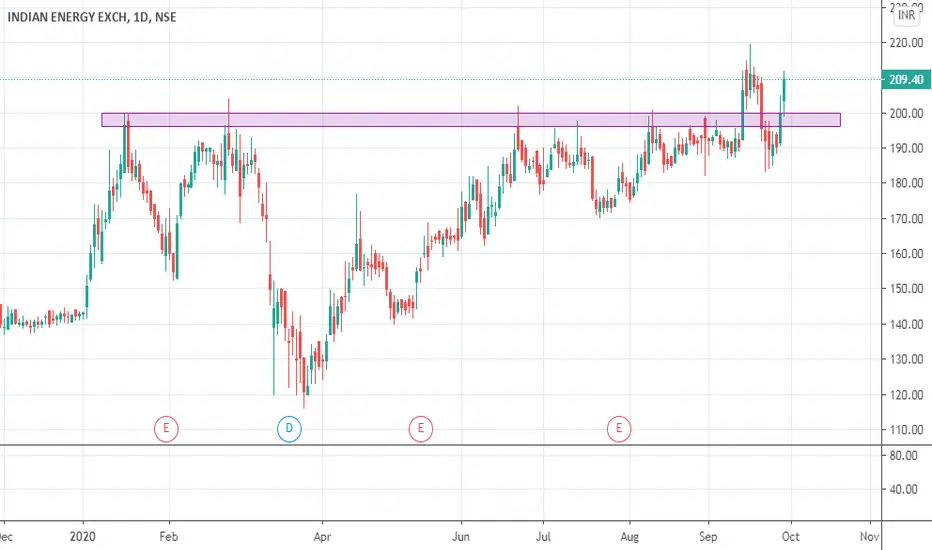
IEX ready to break the channel, most probably on upside.IEX is closing to break 9 month channel, most probably on upside.
IEX made 7 attempts on to break 198 levels, it cleared in 8th attempt but sharp pullback in Nifty threw it in channel again.
IEX has made 5 higher highs and that's interesting.
IEX's 50 DMA is 188.50 and offers good support.
With 184.50 SL (3%) it offers significant upside in coming days if market is stable.
Risk:Reward 1:5


