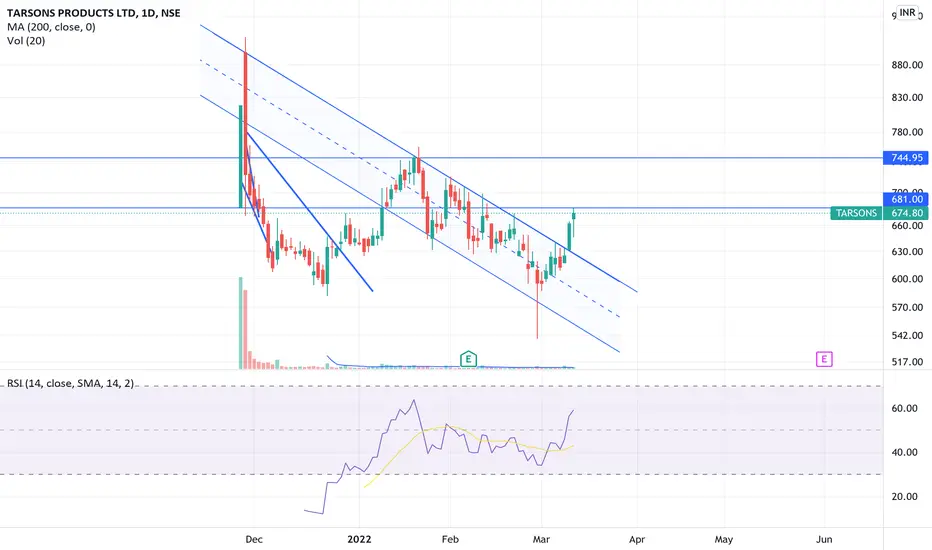
High chance of bull in Tarson.If it breaks 504 with the closing of the body candle, we could see 560 with a stop-loss of 444. For educational purpose, please take advice from the advisor before taking trade.
Next report date
≈
May 26
Report period
Q4 2024
EPS estimate
—
Revenue estimate
—
5.60 INR
426.40 M INR
2.96 B INR
14.47 M
About TARSONS PRODUCTS LTD
Sector
Industry
CEO
Sanjive Sehgal
Website
Headquarters
Kolkata
Founded
1983
ISIN
INE144Z01023
FIGI
BBG013JKHKC1
Tarsons Products Ltd. engages in the production and supply of laboratory plastic ware for use within molecular biology, cell culture, genomics, proteomics and immunology. It offers disposable plastic labware, centrifuge ware, cryo labware, liquid handling system and instruments. The firm's product categories include: bottles & carboys, boxes and racks, cell culture products, centrifuge ware, cryoware, electrophoresis, general lab ware and PCR products. The company was founded on July 5, 1983 and is headquartered in Kolkata, India.
4.5%
7.5%
10.5%
13.5%
16.5%
Q3 '23
Q4 '23
Q1 '24
Q2 '24
Q3 '24
0.00
300.00 M
600.00 M
900.00 M
1.20 B
Revenue
Net income
Net margin %
Revenue
COGS
Gross profit
Op expenses
Op income
Non-Op income/ expenses
Taxes & Other
Net income
0.00
250.00 M
500.00 M
750.00 M
1.00 B
Revenue
COGS
Gross profit
Expenses & adjustments
Net income
0.00
250.00 M
500.00 M
750.00 M
1.00 B
Q3 '23
Q4 '23
Q1 '24
Q2 '24
Q3 '24
0.00
800.00 M
1.60 B
2.40 B
3.20 B
Debt
Free cash flow
Cash & equivalents
No news here
Looks like there's nothing to report right now


BUY TODAY SELL TOMORROW for 5% DON’T HAVE TIME TO MANAGE YOUR TRADES?
- Take BTST trades at 3:25 pm every day
- Try to exit by taking 4-7% profit of each trade
- SL can also be maintained as closing below the low of the breakout candle
Now, why do I prefer BTST over swing trades? The primary reason is that I have observed t

W Pattern in TARSON PRODUCTWe could see W pattern in Tarson Product. If the resistance break, we can expect the up move in upcoming days.
Disclaimer: This analysis is purely for educational purpose and does not contain any recommendation. Please consult your financial advisor before taking any financial decision.


TARSONS PRODUCTS is on the verge of breakout@Tarsons Products is on the verge of breakout as we can see the symmetrical triangle pattern is formed.
We have to wait for volume confirmation.
perfect time to take entry or just wait for the further volume confirmation and with the Target of 890.
Happy Trading & Diwali too!


See all ideas
Summarizing what the indicators are suggesting.
Neutral
SellBuy
Strong sellStrong buy
Strong sellSellNeutralBuyStrong buy
Neutral
SellBuy
Strong sellStrong buy
Strong sellSellNeutralBuyStrong buy
Neutral
SellBuy
Strong sellStrong buy
Strong sellSellNeutralBuyStrong buy
An aggregate view of professional's ratings.
Neutral
SellBuy
Strong sellStrong buy
Strong sellSellNeutralBuyStrong buy
Neutral
SellBuy
Strong sellStrong buy
Strong sellSellNeutralBuyStrong buy
Neutral
SellBuy
Strong sellStrong buy
Strong sellSellNeutralBuyStrong buy
Displays a symbol's price movements over previous years to identify recurring trends.
Frequently Asked Questions
The current price of TARSONS is 310.30 INR — it has decreased by −4.17% in the past 24 hours. Watch TARSONS PRODUCTS LTD stock price performance more closely on the chart.
Depending on the exchange, the stock ticker may vary. For instance, on NSE exchange TARSONS PRODUCTS LTD stocks are traded under the ticker TARSONS.
TARSONS stock has risen by 6.27% compared to the previous week, the month change is a 2.68% rise, over the last year TARSONS PRODUCTS LTD has showed a −23.57% decrease.
We've gathered analysts' opinions on TARSONS PRODUCTS LTD future price: according to them, TARSONS price has a max estimate of 760.00 INR and a min estimate of 347.00 INR. Watch TARSONS chart and read a more detailed TARSONS PRODUCTS LTD stock forecast: see what analysts think of TARSONS PRODUCTS LTD and suggest that you do with its stocks.
TARSONS reached its all-time high on Nov 29, 2021 with the price of 924.90 INR, and its all-time low was 280.00 INR and was reached on Feb 18, 2025. View more price dynamics on TARSONS chart.
See other stocks reaching their highest and lowest prices.
See other stocks reaching their highest and lowest prices.
TARSONS stock is 8.08% volatile and has beta coefficient of 1.09. Track TARSONS PRODUCTS LTD stock price on the chart and check out the list of the most volatile stocks — is TARSONS PRODUCTS LTD there?
Today TARSONS PRODUCTS LTD has the market capitalization of 17.22 B, it has increased by 2.10% over the last week.
Yes, you can track TARSONS PRODUCTS LTD financials in yearly and quarterly reports right on TradingView.
TARSONS PRODUCTS LTD is going to release the next earnings report on May 26, 2025. Keep track of upcoming events with our Earnings Calendar.
TARSONS net income for the last quarter is 52.59 M INR, while the quarter before that showed 102.91 M INR of net income which accounts for −48.90% change. Track more TARSONS PRODUCTS LTD financial stats to get the full picture.
Yes, TARSONS dividends are paid annually. The last dividend per share was 2.00 INR. As of today, Dividend Yield (TTM)% is 0.62%. Tracking TARSONS PRODUCTS LTD dividends might help you take more informed decisions.
TARSONS PRODUCTS LTD dividend yield was 0.51% in 2023, and payout ratio reached 24.96%. The year before the numbers were 0.00% and 0.00% correspondingly. See high-dividend stocks and find more opportunities for your portfolio.
As of Mar 26, 2025, the company has 823 employees. See our rating of the largest employees — is TARSONS PRODUCTS LTD on this list?
EBITDA measures a company's operating performance, its growth signifies an improvement in the efficiency of a company. TARSONS PRODUCTS LTD EBITDA is 1.04 B INR, and current EBITDA margin is 34.46%. See more stats in TARSONS PRODUCTS LTD financial statements.
Like other stocks, TARSONS shares are traded on stock exchanges, e.g. Nasdaq, Nyse, Euronext, and the easiest way to buy them is through an online stock broker. To do this, you need to open an account and follow a broker's procedures, then start trading. You can trade TARSONS PRODUCTS LTD stock right from TradingView charts — choose your broker and connect to your account.
Investing in stocks requires a comprehensive research: you should carefully study all the available data, e.g. company's financials, related news, and its technical analysis. So TARSONS PRODUCTS LTD technincal analysis shows the sell today, and its 1 week rating is sell. Since market conditions are prone to changes, it's worth looking a bit further into the future — according to the 1 month rating TARSONS PRODUCTS LTD stock shows the sell signal. See more of TARSONS PRODUCTS LTD technicals for a more comprehensive analysis.
If you're still not sure, try looking for inspiration in our curated watchlists.
If you're still not sure, try looking for inspiration in our curated watchlists.