Why dont Global Warming Cucks ever short heating oil?Here is your chance. Stop watching BIll Nye for a few minutes and open some LEVERAGED shorts on Heating Oil. The science is settled right? Only an idiot would DENY this?
Go ahead!
(None of them actually do this when challenged because 1) They are broke Soy Boy's and 2) they know its not settled science
GK1! trade ideas


Where will Energy bottom?Further to my recent "oil sell-off complete" chart (linked), I'm much more cautious getting long energy, especially because of this heating oil chart.
Will see how both my Brent crude and heating oil charts line up going forward but I expect Brent to be considerably below my target zone by the time this heating oil chart drops into the 2.04 and below buy zone.


HEATING OIL FUTURES (DEC 2018), 1D, NYMEXTrading Signal
Short Position (EP) : 2.1907
Stop Loss (SL) : 2.212
Take Profit (TP) : 2.1167, 2.0996
Description
HOZ2018 formed DRF Sell at 1d time frame. Trade setup with Sell Limit at 0.382 Level (2.1907) and place stop after 0.618 level (2.212). Once the position was hit, place take profit before an agreement (2.1167) and 2.0996
Money Management
Money in portfolio : $280,000
Risk Management (1%) : $2,800
Position Sizing
$0.0001 = +-$4.2
Commission fee = -$2.37/std-contract
EP to SL = $0 = -$894.6
Contract size to open = 3 standard contracts
EP to TP#1 = $0.07 = +$3,108
EP to TP#2 = $0.09 = +$3,826.2
Expected Result
Commission Fee = -$14.22
Loss = -$2,683.8
Gain#1 = +$6,216
Gain#2 = +$3,826.2
Total Gain = +$10,042.2
Risk/Reward Ratio = 3.72

Heating Oil: Has it just found support?Heating Oil has just made a Higher Low (RSI = 52.430, Highs/Lows = 0.0000) at 2.1600 on the 1W Channel Up that has been dictating its direction since January. Technically this is an ideal long term long entry towards the 2.4466 High.
However on the monthly chart and the 1M Channel Up (RSI = 60.743, MACD = 0.148, Highs/Lows = 0.0482) that started on January 2016, we notice repeated patterns within the wider formation. Those suggest a value of and Higher Low near 2.000 before the Channel Up resumes its long term uptrend.
In both cases Heating Oil is a long term buy.
** If you like our free content follow our profile (www.tradingview.com) to get more daily ideas. **
Comments and likes are greatly appreciated.

Long term Channel Up. Buy.Heating Oil is trading within a very long term 1W Channel Up (RSI = 60.650, MACD = 0.049, Highs/Lows = 0.0425), highly volatile, but after having made a Lower High, seen on a strong 1D Channel Up. We are long aiming first at 2.3061 and 2.3404 in extension.


HO bull trend Heating oil in a light bull trend since 2016. The market is moving in upward channel. Likely to pull back at the current levels. Look for selling opportunities next week. Probability H.

1D Channel Down. Short on low break out.Heating Oil is trading within a long term 1D Channel Down and is coming off the most recent Lower High (RSI = 45.169, MACD = -0.007, Highs/Lows = -0.0171, B/BP = -0.0334). The downside potential is significant but we will only go short if the August 02 low (2.0863) breaks. TP = 2.0421.

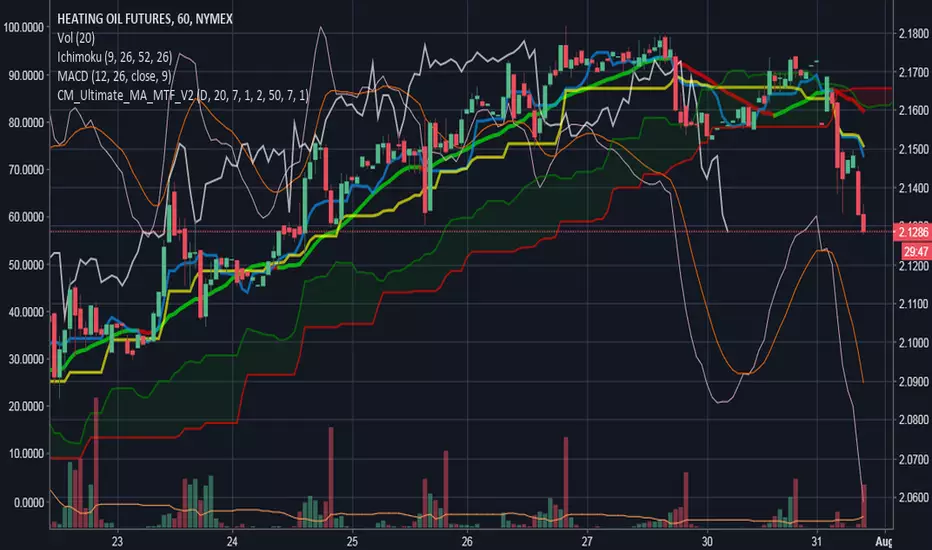
Best tools to trade Heating OilBeen doing some research the past week to test different tools to read this market and so far ichimoku and the CM_ULTIMATE_... (long name, created using combo of multiple tools) work the best.... Also i see the MACD helps along too but most definitely not needed but helps confirm signals but not as good as the other 2 on this market imo.
Entered the market a week ago with a buy and was able to contineously follow market trend until today when signal seemed to indicate it's time to bail. Just look at the screenshot of my chart. You can get a free trial with tradingview to have access to all tools and make some money to upkeep your subscription.
If you know ichimoku then you should be able to see how it very well depiects trend and when to exit and should be able to see the CM_ tool changing in color to depiect when going bull and bear.
Gulf Coast Jet Fuel FuturesProposed EW count for Gulf Coast Jet Fuel Futures:
Box denotes the wave travel of the minuette wave (I am not careful about using the correct EW notations) travel. I was tempted to label that as inermediate wave (3) but it would be the shortest wave and that wouldn't stack up.
I would be looking for wave C to possibly make a 1:1 or 1:1.618 extension for sub-wave (c). If price is held by the approx trend-line then an extension of wave (5) is still in play, If the trend-line doesn't hold this would validate the count and point towards a retracement of the 5 wave move (no targets as yet - although $1.55 seems like a plausible initial target).


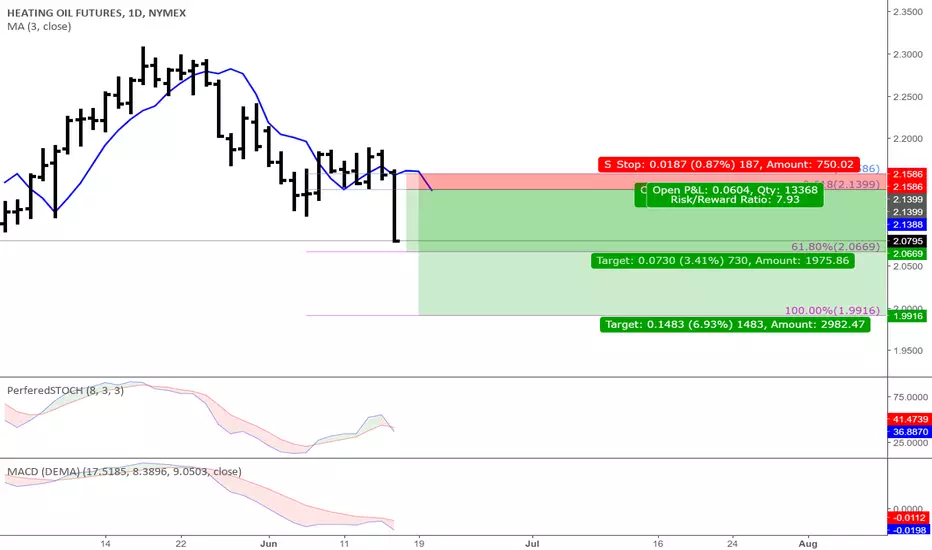
HEATING OIL Future JUL18 (1d)Trading Signal
Short Position (EP) : 2.1399
Stop Loss (SL) : 2.1586
Take Profit (TP) : 2.0669, 1.9916
Description
RB formed Double Repo Failure Sell at 1d time frame. Trade setup with Sell Limit at 0.382 Level (2.1399) and place stop after 0.618 level (2.1586). Once the position was hit, place take profit before an agreement (2.0669) and 1.9916
Money Management
Money in portfolio : $80,000
Risk Management (2%) : $1,600
Position Sizing
$0.0001 = +-$4.20 (Standard)
Commission fee = -$2.47/contract (Standard)
EP to SL = $0.0187 = -$785.40/contract (STD)
Contract size to open = 2 standard contracts
EP to TP#1 = $0.0730 = +$3,066.00 (STD)
EP to TP#2 = $0.1483= +$6,228.60 (STD)
Expected Result
Commission Fee = -$19.76
Loss = -$1,570.80
Gain#1 = +$3,066.00
Gain#2 = +$6,228.60
Total Gain = +$9,294.60
Risk/Reward Ratio = 5.92

Odds Favor Pullback in HOIn scrolling through the intra-day charts, I came across a rather bearish looking pattern being painted by the algos.
This caught my attention and warranted further investigation - What I found was a confluence of bearish indicators that argue for making a short bet here. Lets take a look at the evidence.
1 - The COT report as of 10/3 shows that Commercials current net position, based on our proprietary scoring scale, ranks a extremely bearish 5% on a 18m basis and even worse 4% on a 5yr basis. But what does this score tell us?
In reviewing our Actuarial tables on price we see that since 2004, over a 20 day trading interval, the 80th percentile moves in HO from a random close is .0436 up by (.0336) down. The 70th percentile move is .0673 by (.0532). So price distribution favors bulls by odds of about 1.3 to 1.
However, when we see commercial net position 18m scores of < 7%, price distribution in the 80th percentile changes drastically to now only .0265 up by (.0518) down. And the 70th percentile moves are now .036 up by (.057)down.
So when commercials are positioned this bearishly, price distribution odds move from 1.3 to 1 bulls, to favoring bears by 2-1 in the 80th percentile and 1.6 to 1 in the 70th percentile.
This is a significant shift, and Bears have a clear edge.
2 - Next we check the seasonal tables and see that since 1990 Heating Oil's worst performing month is October with a lousy 32% winning %. followed by a 44% win rate in November. The average loss in Oct periods is almost 11 cents.
3 - The technical picture on the price chart is very negative currently.
A - We have a massive rally from 1.35 to 1.86 or 38% over 3 months. We are now seeing signs of price stalling, and a quite normal 50% retrace of this move would take you to $1.60 or 17 cents lower.
B - Our proprietary oscillator is showing a failed buy signal. So price bounced off the oversold levels, however instead of moving towards overbought, we are seeing stalling in the 50 range - Now the indicator is hooking lower, signaling a new price decline ahead.
So technicals are pointing to a sell-off, and we have confirmed the odds favor a bet lower.
However - Tomorrow there is a potential catalyst in the oil market as Trump will likely announce exit from the Iran deal and/or other potential sanctions - You could see Oil bid, in which case HO would follow suit.
Lets wait until after the noon announcement before entering a trade. Ideally we will see Oil & HO pop higher & we'll get a chance to short it near the right shoulder high in the 1.80 area.
- Will update trade economics tomorrow.
Please visit our blog for Alchymist Data tables and graphs as well as more in depth analysis.
Good Trading,
3ptCapital

HO Heating Oil - will it hold?Remains to be seen - something to watch over the next two or three trading sessions. Fib levels are natural S/R zones and can be used as targets/entry and exit points moving forward. Until it makes a confirmation with price, we watch and wait.

Heating Oil - BreakOut LONGHeating Oil this week broke above its 2 year high. The move was confirmed with a strong day's close above the high, and now the weekly bar is closing above - N.B: provided that Heating Oil holds in today's session.
Seasonally August & September are strong months which lends another dimension to a pure chartist approach.

HO is setting up like Crude did a few days back.Here is the setup:
1 - Commercial Traders net position ranks 92% on a 18m basis - They have been buying heavily into this decline. Trend following Hedge Funds on the other hand score a very weak 21% so they are still extremely short even after this 30 cent wipeout. Once the technicals start turning, their algo's will be covering to lock in the sizeable gains on their shorts.
2 - Seasonality is very favorable for HO - Going back to 1979, HO sports a impressive winning % of 66% in the month of July.
3 - Crude has been rallying & turning trends neutral from down - HO followed suit today with the convincing move through the Down trend line that has been in force from the 1.63 range.
So we've stopped falling, and now a counter trend rally has begun.
How to trade it:
For trend reversals we like to see a test of the low, and then a higher low made - We can use that as our pivot point.
Wait until after the EIA report tomm so that you sidestep any bankster fleecing/stop running & then look to establish your long position.
A 50% FIB retrace of this sizeable decline gets us to 1.50 or 8.5 cents from here - A lot of room to run, even if a higher level bear market is still in play.
Good trading to all.


***Short Opp***Crude oil contract has not gave us a signal yet as NY Harbor ULSD has.
We looking to go short here.
$5,178.60 / Contract profit potential
$4,125 initial margin

***Short Opp***All signals the same as Crude oil WTI.
Futures trading involves risk of loss and is not suitable for all investors.

