Crude Short Reason for Trade:
Trending upwards but its time for reversal
1.Near the daily resistance line
2.Trend line broken
3.Last lower high broken
4.Below EMA 33
5.High selling volume
SL: 69.80
EP:68.85
TP: 65
WTI1! trade ideas


Crude Oil Set for Mixed Outcomes Amidst Economic Tensions
- Key Insights: The crude oil market is experiencing mixed signals, with recent
positive momentum but an overarching bearish sentiment. Despite the slight
uptick, the market remains sensitive to economic and geopolitical factors,
suggesting cautious trading strategies. Investors should monitor key support
and resistance levels closely to inform trading decisions.
- Price Targets: Next week, traders might consider these targets:
- T1: $70.50, T2: $72.00
- S1: $66.50, S2: $65.00
This positioning aligns with the anticipation of potential upward movement while
guarding against lower breaks.
- Recent Performance: Crude oil has recently closed above key moving averages,
hinting at possible short-term gains. However, the broader market is
bearish, influenced by decreasing oil and gasoline prices, which may reduce
overall economic costs. The market's volatility is driven by broader
economic conditions and geopolitical influences.
- Expert Analysis: Opinions in the oil market are divided, with some experts
foreseeing bearish trends due to supply constraints and production capacity
issues. Others remain bullish in the long term, expecting economic
conditions like stagflation and inflation to drive demand and prices higher.
The imminent strengthening of the US dollar and its impact on linked indices
remains an area of attention.
- News Impact: Several notable events are influencing crude oil. Concerns about
sustaining production levels amidst declining rates and constrained spare
capacity highlight the critical need for investment in new projects.
Geopolitical tensions involving key global players are impacting supply
chains and pricing, potentially escalating inflationary pressures. Within
the sector, shifting production strategies and shareholder expectations may
redefine performance prospects in the near term.
Overall, while the short-term outlook might see some gains, traders should
remain cautious and informed, given the complex interplay of economic and
geopolitical factors affecting crude oil.

Weekly Market Forecast WTI CRUDE OIL: Bearish! Wait For SellsThis forecast is for the week of March 17 - 21st.
WTI Crude Oil is in consolidation, but forming a wedge pattern. As the market condenses, we no watch out for a breakout that could go in either direction. But if we take note of the Weekly bearish FVG that formed last week, we simply wait for price to sting into it and use it to move lower. The market is weak, and has been trending down for over two months now. Using the trend and the -FVG, the higher probability is for price to continue lower, as long as the -FVG holds.
Check the comments section below for updates regarding this analysis throughout the week.
Enjoy!
May profits be upon you.
Leave any questions or comments in the comment section.
I appreciate any feedback from my viewers!
Like and/or subscribe if you want more accurate analysis.
Thank you so much!
Disclaimer:
I do not provide personal investment advice and I am not a qualified licensed investment advisor.
All information found here, including any ideas, opinions, views, predictions, forecasts, commentaries, suggestions, expressed or implied herein, are for informational, entertainment or educational purposes only and should not be construed as personal investment advice. While the information provided is believed to be accurate, it may include errors or inaccuracies.
I will not and cannot be held liable for any actions you take as a result of anything you read here.
Conduct your own due diligence, or consult a licensed financial advisor or broker before making any and all investment decisions. Any investments, trades, speculations, or decisions made on the basis of any information found on this channel, expressed or implied herein, are committed at your own risk, financial or otherwise.

Crude Oil Technical Outlook Crude Oil has once again found support near the $65 area, initiating a modest rebound. This bounce may extend toward the $72 level, which I view as a potential area of interest for initiating a short position.
Should price action reach that zone, I would look to enter short with a defined target range between $50 and $42. In this scenario, the stop loss would be fixed at $80.60, preserving a clear and disciplined risk management structure.
I’ll be closely monitoring price behavior and momentum as we approach resistance, particularly looking for signs of exhaustion around $72 to validate the setup.

Crude oil-----sell near 69.00, target 67.00-66.00Crude oil market analysis:
Recently, crude oil has been hovering at the bottom. There are short-term stabilization signals, but it is basically difficult to turn around if you don't buy at 70.00. Today's idea is still bearish. Crude oil is sold regardless of weekly or short-term. Today's idea is still to sell at a high price and bearish. Crude oil pays attention to the inventory data later.
Operational suggestions:
Crude oil-----sell near 69.00, target 67.00-66.00


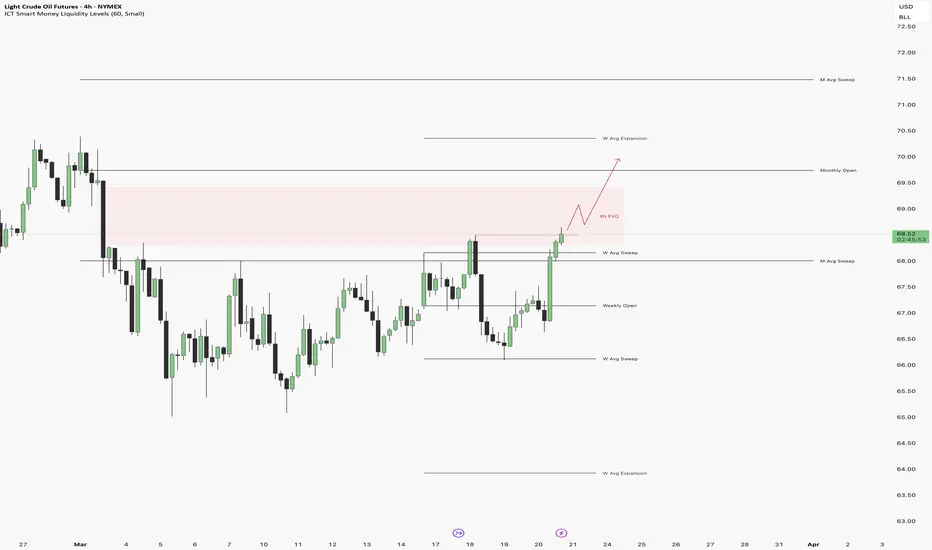
Light Crudeoil Futures hourly trend forecast for March 24, 2025According to my analysis, this commodity is at its strong resistance at 68.46 and the likely support levels are at 67.56 and 66.83.
According to my "Advanced Market Timing" indicator, Light Crudeoil Futures is likely to see a bearish trend and then bounce back.
Those who trade are suggested to use your own technical studies for entries, stops and exits.

#202512 - priceactiontds - weekly update - wti crude oil futuresGood Day and I hope you are well.
comment: 4h chart tells the story the best. No acceptance below 66.5 and above 68. Bulls managed to get the second weekly bull bar but they have gained almost nothing. It could continue up and keep the multi-year contraction alive, since the double bottom at 65 looks good.
current market cycle: trading range
key levels: 65 - 70
bull case: Bulls need to print 70. That’s about it. The double bottom at 65 is decent enough to buy pull-backs with that stop. Bulls also managed to close above the daily 20ema on Friday and above 68. They now need to break above the last bear trend line around 68.5 and are then free to test 70. They do need to prevent another lower low below 65 if they want to have a major trend reversal.
Invalidation is below 65.
bear case: Bears look like they are exhausted and not pushing for new lows. If we close green next week and above 70, clear major trend reversal. Bears could surprise again and push below 65, which would open up targets below 64 and 63. Issue for bears is that below are so many support prices, that it’s hard to argue for more selling but since this is a commodity, could surprise to the downside as well. Technically, bears do not have much below 68. They need to keep the bear trend line around 68.5 alive or give up until market hits 70 again.
Invalidation is above 71.
short term: Neutral but if bulls continue above 68.5, leaning bullish for 70. Odds favor continuation of sideways movement 65-68.
medium-long term - Update from 2025-02-23: Bear trend is getting weaker but I still see this going sideways around 70 instead of a range expansion.
current swing trade: None
chart update: Removed bear trend lines that were broken or likely not relevant anymore.

CRUDE - WEEKLY SUMMARY 17.3-21.3 / FORECAST🛢 CRUDE – 16th week of the base cycle (28 weeks). A double bottom has formed, signaling the start of the second phase. The extreme forecast on March 19 pushed crude upward from a sideways trend. However, the beginning of the second phase is very weak. A strong resistance level lies ahead at 70 on current futures.
👉 My bearish outlook remains unchanged, as outlined in my summer 2024 crude oil post. The crude market has been in a sideways trend since fall 2022. This resembles the 2010-2014 period. Timing suggests a resolution in 2025. However, this does not mean history will repeat exactly—it is simply a similar setup. We will continue to navigate based on the current extreme forecasts.
⚠️ The current base cycle cannot yet be classified as bearish, as it has not broken its starting point. Watch for the midpoint of retrograde Mercury on March 24. The next important extreme forecasts for crude are March 27 and March 31.


Crude oil ------- sell around 70.00, targeCrude oil market analysis:
Yesterday's crude oil daily line closed with a big positive, is it a buying opportunity? In fact, looking at the pattern, it has been hovering at this position for a long time, and the short-term is basically a snake. If the position of 70.00 is not broken, it is difficult to form a buying opportunity. The idea of crude oil today is still bearish. Continue to sell on the rebound. The previous contract delivery of crude oil has not changed the trend. I think it still needs to fluctuate.
Operation suggestion:
Crude oil ------- sell around 70.00, target 68.00-66.00

Crude Oil Futures Stock Chart Fibonacci Analysis 032025Trading Idea
1) Find a FIBO slingshot
2) Check FIBO 61.80% level
3) Entry Point > 67/61.80%
Chart time frame: B
A) 15 min(1W-3M)
B) 1 hr(3M-6M)
C) 4 hr(6M-1year)
D) 1 day(1-3years)
Stock progress: A
A) Keep rising over 61.80% resistance
B) 61.80% resistance
C) 61.80% support
D) Hit the bottom
E) Hit the top
Stocks rise as they rise from support and fall from resistance. Our goal is to find a low support point and enter. It can be referred to as buying at the pullback point. The pullback point can be found with a Fibonacci extension of 61.80%. This is a step to find entry level. 1) Find a triangle (Fibonacci Speed Fan Line) that connects the high (resistance) and low (support) points of the stock in progress, where it is continuously expressed as a Slingshot, 2) and create a Fibonacci extension level for the first rising wave from the start point of slingshot pattern.
When the current price goes over 61.80% level , that can be a good entry point, especially if the SMA 100 and 200 curves are gathered together at 61.80%, it is a very good entry point.
As a great help, tradingview provides these Fibonacci speed fan lines and extension levels with ease. So if you use the Fibonacci fan line, the extension level, and the SMA 100/200 curve well, you can find an entry point for the stock market. At least you have to enter at this low point to avoid trading failure, and if you are skilled at entering this low point, with fibonacci6180 technique, your reading skill to chart will be greatly improved.
If you want to do day trading, please set the time frame to 5 minutes or 15 minutes, and you will see many of the low point of rising stocks.
If want to prefer long term range trading, you can set the time frame to 1 hr or 1 day.


Will oil prices collapse to $60?Is there a chance for oil prices to fall to $60?
On Wednesday, WTI crude oil futures continued to rise and settled around $68.3 per barrel. This was the third consecutive day of gains amid growing concerns about supply disruptions caused by ongoing conflicts in the Middle East. The Israeli airstrike on Gaza and U.S. President Trump's threat to hold Iran accountable for any Houthi attacks in Yemen have heightened tensions in the region and contributed to the rise in oil prices.
One of the main causes of the recent price rise has been an expected increase in demand from China, the world's largest oil importer. This is due to its economic stimulus plans and positive data on the economy. However, the potential rise in prices could be held back by progress in peace negotiations between Russia and Ukraine, which could lead to increased supply in the global market. In addition, U.S. President Trump is expected to talk with Putin today to try to end the ongoing war between the two countries.
Another significant risk factor for oil prices is escalating trade tensions, which is worrying investors about economic growth and energy demand.
Currently, oil is not having a good time, with a 5 percent decline in quotations over the past three months. The main cause of this pressure is OPEC+'s announcement to increase production in April. In addition, markets are preparing for the impact of U.S. tariffs on Canada, Mexico, and China, and possible retaliatory measures by China against the United States.
Concerns about a possible global trade war are affecting the energy market. Fears are that this could hurt economic growth and reduce energy demand, leading to an uncertain situation where supply from the OPEC cartel is increasing while demand remains unstable.
The news is not very positive as oil production continues to increase. The Organization of the Petroleum Exporting Countries (OPEC) and its allies, such as Russia, known as OPEC+, have decided to increase oil production by 138,000 barrels per day starting in April, a move that marks the first increase since 2022. Although this increase aims to phase out previous production cuts, it has raised concerns about a potential abundance of supply in the market.
The 25 percent tariffs on goods from Mexico and Canada went into effect at the same time as the 10 percent increase on Chinese goods. In response, Beijing immediately imposed taxes of up to 15% on imports of key U.S. agricultural products. The current situation leads to a widespread and dangerous trade war, which can negatively affect economic growth and the outlook on oil demand.
When studying oil, it is also essential to consider the trading currency, which is the dollar. In 2025, I predict that the dollar will continue to strengthen while the Fed keeps interest rates high. This may not be favorable for oil prices.
From a technical point of view, the situation on Oil is even worse. The decline is accompanied by above-average volumes, and prices remain consistently below the 200-period moving average.
According to my forecast, oil prices are expected to stabilize around $60 per barrel in the coming quarters.
If you would like to be notified whenever I post a new article, just click on “FOLLOW” at the top. Also, if you would like to elaborate on a particular topic or need some advice, please comment below the article and I will be happy to help you.


Crude oil---sell near 68.20, target 66.00-65.20Crude oil market analysis:
Crude oil has been hovering at the bottom recently. It is necessary to short it at the high suppression position. It is difficult to make a profit by shorting in the middle and chasing. Today's idea is to continue to short it after the rebound. Pay attention to the suppression near 68.00-68.50. Crude oil is basically difficult to change the trend in the short term. Yesterday's crude oil contract delivery was not big. The price of the new contract is basically the same as the old one.
Fundamental analysis:
The Federal Reserve will maintain the benchmark interest rate at 4.25%-4.50%, which is in line with market expectations. The dot plot shows that it is expected to cut interest rates twice in 2025. The Federal Reserve will begin to slow down the pace of balance sheet reduction on April 1.
Operational suggestions:
Crude oil---sell near 68.20, target 66.00-65.20


Possible upward pullbackCrude oil is on a bearish trend based on higher timeframes but is currently showing bullish pressure as a potential pullback. The potential upward pullback may try to retest the 70.0 barrier. Breaking further and settling above the 70.0, may see a rise towards resistance barriers between 71.00 and 73.00 as potential bearish sell zones.

Crude Oil Futures: Downtrend Intact or Trend Reversal ?
Support: $64.50 (Recent low and lower Bollinger Band)
Resistance: $67.50 - $68.00 (Near-term resistance, where the price is currently struggling)
If the price fails to hold above $66 and breaks below $64.50, further downside towards $63 may occur.
Watch the Middle Bollinger Band: A close above it often signals further upside. Failing there could point to another leg down or sideways action.


Crude Oil Market Outlook: Long-Term AnalysisTechnical Analysis: A Broader Perspective
Crude oil has been trading in a multi-year consolidation range, with prices repeatedly testing both the upper and lower boundaries.
Support Levels:
Oil is currently trading around $66-$65, which has acted as a key support zone over the past few years.
Historically, crude has bounced from this area, making it a significant level to watch for potential accumulation.
Resistance Levels:
The 100-day and 200-day moving averages sit above the current price, with resistance levels around $75 and $85.
These levels need to be reclaimed for a sustained uptrend to develop.
Trend Outlook:
Over the past two years, crude oil has remained range-bound, consolidating between $65 on the lower end and $85-$90 on the upper end.
Given this prolonged pattern, we could be approaching the bottom of this range, setting the stage for another potential cycle higher.
A break below $61-$60 would indicate a deeper correction, possibly pushing oil into a longer-term downtrend.
Market Momentum Indicators:
RSI is near oversold territory, suggesting the market is at a level where a bounce has historically occurred.
PPO remains negative, indicating weak momentum, but a shift towards bullish divergence would reinforce a recovery case.
Market News & Fundamental Drivers
Several macroeconomic and geopolitical developments are shaping crude oil’s outlook:
1. Geopolitical Risks & OPEC+ Policy
Middle East Tensions:
Ongoing U.S. military activity in Yemen has introduced geopolitical uncertainty, which could drive up oil prices.
Historically, geopolitical disruptions have led to sudden price spikes, making this a critical factor to monitor.
OPEC+ Production Adjustments:
Despite announced production cuts, increased exports of refined products by OPEC nations are offsetting crude supply reductions.
This has limited the bullish impact of output cuts and prevented oil from breaking out of its long-term consolidation range.
2. Economic Demand & Global Growth
China’s Economic Stimulus:
China remains the world’s largest oil importer, and recent stimulus measures aimed at boosting consumption have supported oil demand.
Retail sales and industrial production in China exceeded expectations, which has provided a short-term tailwind for crude.
U.S. Economic Uncertainty & Tariff Concerns:
The Biden administration’s reciprocal tariffs, set to take effect in April, have raised concerns about global economic growth.
A slowdown in trade and manufacturing activity could put downward pressure on oil demand.
3. Structural Demand Shift: The Rise of EVs
Electric Vehicles (EVs) are impacting long-term oil demand.
China’s EV boom is accelerating faster than expected, reducing future oil consumption.
Major oil producers are beginning to factor in a slower demand outlook, which could keep prices in check over the long term.
Conclusion: A Key Inflection Point for Crude Oil
Crude oil is at a critical support level, sitting at the bottom of a multi-year consolidation range around $65-$66.
If this level holds, we could see a bounce toward the $75-$85 resistance zone in the coming months.
However, a break below $60-$61 would signal a bearish structural shift and open the door for further downside.
Geopolitical risks, OPEC supply dynamics, and global economic conditions remain the key fundamental drivers influencing oil prices.
For now, traders and investors should monitor the $65 support level closely. If we see a breakout above the 100-day and 200-day moving averages, it could indicate the start of a new bullish trend within the existing range.

The price has formed a small bull flag consolidation after breakThe price has formed a small bull flag consolidation after breaking above key resistance at $67.00
Trading above all short-term moving averages (orange/red lines)
Showing higher lows and higher highs, suggesting bullish momentum
Key supports are holding with multiple tests
Risk Management for Weekend:
Since we're heading into the weekend, it's crucial to manage risk properly:
Consider taking partial profits at the first target ($68.71)
Trail your stop loss to breakeven after reaching the first target
If already up substantially by late session, consider closing the position to avoid weekend gap risk
Alternative Plan:
If the price rejects at current levels and falls below $67.00:
Abandon the long thesis
Look for potential short entry below $66.80
Target $66.46 support
The most likely scenario based on current price action is a continued move toward the $68.71-$68.73 resistance zone before the weekend. The break above the descending trendline and the recent higher lows pattern suggest the momentum remains to the upside, making a long position the highest probability trade for today.
