DOUBLED overnight! $1.18 to $3+ $ENVBDOUBLED overnight 🚀 $1.18 to $2.98 the only stock mentioned in chat after hours yesterday twice 🔥 NASDAQ:ENVB
When this happens then you know it's got to be special
Enveric Biosciences, Inc.
1.20USDR
−0.04−3.23%
As of today at 15:44 GMT
USD
No trades
Next report date
≈
August 18
Report period
Q2 2025
EPS estimate
−5.25 USD
Revenue estimate
—
−13.34 USD
−9.57 M USD
0.00 USD
2.14 M
About Enveric Biosciences, Inc.
Sector
Industry
CEO
Joseph Tucker
Website
Headquarters
Naples
Founded
1994
FIGI
BBG000BBQ281
Enveric Biosciences, Inc. develops cannabinoid medicines and combination therapies. It is a patient-centric biotechnology company endeavouring to enhance the lives of those who are adversely affected by the side effects of Cancer Treatments. The firm is testing natural compounds, starting with cannabinoids to provide patients and clinicians with novel prescription medicines to serve these unmet medical needs. The company was founded on February 28, 1994 and is headquartered in Naples, FL.
Q1 '24
Q2 '24
Q3 '24
Q4 '24
Q1 '25
−3.20 M
−2.40 M
−1.60 M
−800.00 K
0.00
Revenue
Net income
Net margin %
Revenue
COGS
Gross profit
Op expenses
Op income
Non-Op income/ expenses
Taxes & Other
Net income
−2.40 M
−1.80 M
−1.20 M
−600.00 K
0.00
Revenue
COGS
Gross profit
Expenses & adjustments
Net income
−2.40 M
−1.80 M
−1.20 M
−600.00 K
0.00
Q1 '24
Q2 '24
Q3 '24
Q4 '24
Q1 '25
−3.00 M
0.00
3.00 M
6.00 M
9.00 M
Debt
Free cash flow
Cash & equivalents
No news here
Looks like there's nothing to report right now

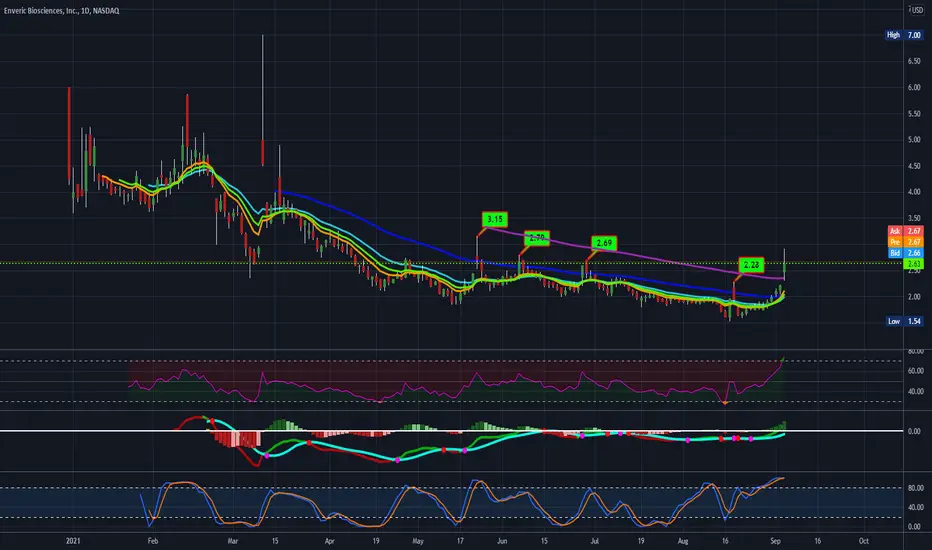
ENVB Waiting for a Double Bottom Before EnteringIt is possible this one was missed, but I think there could be some trouble getting through this resistance. Mays volume was 10x where this resistance was, but it still didn’t get through. Possible this could trade sideways for a couple of months before retracing back down to the support level.
Th

ENVB | So Many Bullish Divergences | LONGEnveric Biosciences, Inc., a pharmaceutical company, engages in developing various cannabinoid medicines for cancer care. Its products pipeline includes EV104 for the treatment of osteoarthritis; EVM-101 and EVM-201 for the treatment of cancer related distress; EVM-301 for the treatment of mental he


$ENVB is gonna fall todayPupm&Dump trading strategy idea.
$ENVB is rising too much today.
The demand for shares of the company looks lower than the supply.
This and other conditions can cause a fall in the share price today.
So I opened a short position from $2,59;
stop-loss — $2,77;
take-profit — $2,22/MOC
Do not view


$ENVB Target PTs 5.50-6-7 and higherEnveric Biosciences, Inc., a biotechnology company, engages in developing various cannabinoid medicines to enhance quality of life for cancer patients. It has a pipeline of development programs for radiodermatitis, glioblastoma, and chemotherapy-induced neuropathy. The company is based in Naples, Fl

See all ideas
Summarizing what the indicators are suggesting.
Neutral
SellBuy
Strong sellStrong buy
Strong sellSellNeutralBuyStrong buy
Neutral
SellBuy
Strong sellStrong buy
Strong sellSellNeutralBuyStrong buy
Neutral
SellBuy
Strong sellStrong buy
Strong sellSellNeutralBuyStrong buy
An aggregate view of professional's ratings.
Neutral
SellBuy
Strong sellStrong buy
Strong sellSellNeutralBuyStrong buy
Neutral
SellBuy
Strong sellStrong buy
Strong sellSellNeutralBuyStrong buy
Neutral
SellBuy
Strong sellStrong buy
Strong sellSellNeutralBuyStrong buy
Displays a symbol's price movements over previous years to identify recurring trends.
Frequently Asked Questions
The current price of ENVB is 1.20 USD — it has decreased by −3.23% in the past 24 hours. Watch Enveric Biosciences, Inc. stock price performance more closely on the chart.
Depending on the exchange, the stock ticker may vary. For instance, on NASDAQ exchange Enveric Biosciences, Inc. stocks are traded under the ticker ENVB.
ENVB stock has fallen by −4.69% compared to the previous week, the month change is a −10.95% fall, over the last year Enveric Biosciences, Inc. has showed a −89.69% decrease.
ENVB reached its all-time high on Sep 15, 1995 with the price of 82,546,875.00 USD, and its all-time low was 1.01 USD and was reached on Apr 9, 2025. View more price dynamics on ENVB chart.
See other stocks reaching their highest and lowest prices.
See other stocks reaching their highest and lowest prices.
ENVB stock is 4.64% volatile and has beta coefficient of 0.78. Track Enveric Biosciences, Inc. stock price on the chart and check out the list of the most volatile stocks — is Enveric Biosciences, Inc. there?
Today Enveric Biosciences, Inc. has the market capitalization of 3.04 M, it has decreased by −5.47% over the last week.
Yes, you can track Enveric Biosciences, Inc. financials in yearly and quarterly reports right on TradingView.
Enveric Biosciences, Inc. is going to release the next earnings report on Aug 18, 2025. Keep track of upcoming events with our Earnings Calendar.
ENVB earnings for the last quarter are −1.22 USD per share, whereas the estimation was −6.00 USD resulting in a 79.67% surprise. The estimated earnings for the next quarter are −5.25 USD per share. See more details about Enveric Biosciences, Inc. earnings.
ENVB net income for the last quarter is −2.18 M USD, while the quarter before that showed −3.15 M USD of net income which accounts for 30.74% change. Track more Enveric Biosciences, Inc. financial stats to get the full picture.
No, ENVB doesn't pay any dividends to its shareholders. But don't worry, we've prepared a list of high-dividend stocks for you.
As of Jun 13, 2025, the company has 5 employees. See our rating of the largest employees — is Enveric Biosciences, Inc. on this list?
Like other stocks, ENVB shares are traded on stock exchanges, e.g. Nasdaq, Nyse, Euronext, and the easiest way to buy them is through an online stock broker. To do this, you need to open an account and follow a broker's procedures, then start trading. You can trade Enveric Biosciences, Inc. stock right from TradingView charts — choose your broker and connect to your account.
Investing in stocks requires a comprehensive research: you should carefully study all the available data, e.g. company's financials, related news, and its technical analysis. So Enveric Biosciences, Inc. technincal analysis shows the sell today, and its 1 week rating is sell. Since market conditions are prone to changes, it's worth looking a bit further into the future — according to the 1 month rating Enveric Biosciences, Inc. stock shows the sell signal. See more of Enveric Biosciences, Inc. technicals for a more comprehensive analysis.
If you're still not sure, try looking for inspiration in our curated watchlists.
If you're still not sure, try looking for inspiration in our curated watchlists.