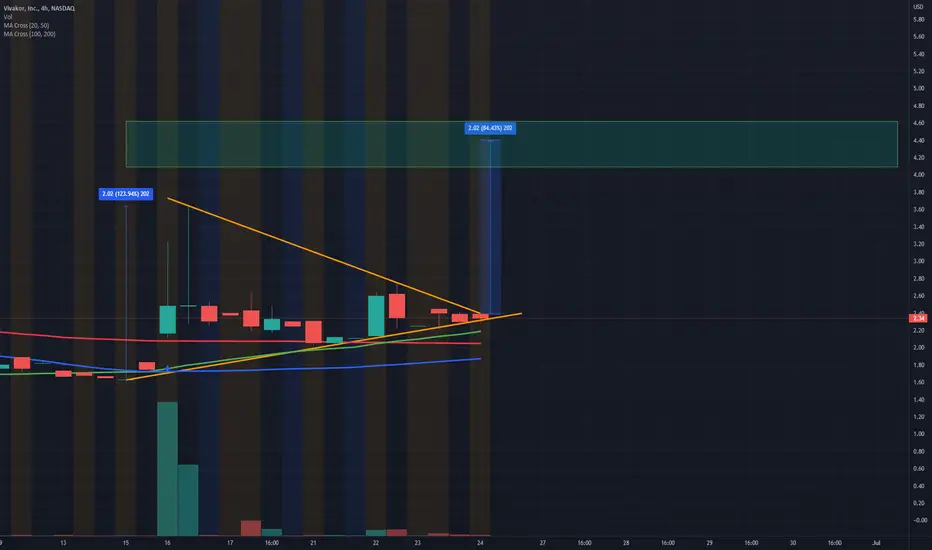
VivakorIn case of daily close above 1.25 with high volumes ill take a set up with a SL around 1.10usd.
The first target will be around 3.00usd.
Price is stuck in a tight daily range which is an historic low level.
I love this kind of situation.
Next report date
≈
May 22
Report period
Q4 2024
EPS estimate
0.08 USD
Revenue estimate
20.04 M USD
−0.4210 USD
−10.74 M USD
59.32 M USD
17.22 M
About Vivakor, Inc.
Sector
Industry
CEO
James H. Ballengee
Website
Headquarters
Dallas
Founded
2006
FIGI
BBG000NHCWQ4
Vivakor, Inc. engages in the operation, acquisition, and development of clean energy technologies and environmental solutions that focus on soil remediation. It specializes in the remediation of soil and the extraction of hydrocarbons, such as oil, from properties contaminated by or laden with heavy crude oil and other hydrocarbon-based substances. The company focuses on the remediation of contaminated soil and water resulting from either man-made spills or naturally occurring deposits of oil. Its primary focus is remediation of oil spills resulting from the Iraqi invasion of Kuwait and naturally occurring oil sands deposits in the Uinta basin located in Eastern Utah. The company was founded on November 1, 2006 and is headquartered in Dallas, TX.
−30%
−25%
−20%
−15%
−10%
Q3 '23
Q4 '23
Q1 '24
Q2 '24
Q3 '24
−6.00 M
0.00
6.00 M
12.00 M
18.00 M
Revenue
Net income
Net margin %
Revenue
COGS
Gross profit
Op expenses
Op income
Non-Op income/ expenses
Taxes & Other
Net income
−6.00 M
0.00
6.00 M
12.00 M
18.00 M
Revenue
COGS
Gross profit
Expenses & adjustments
Net income
−6.00 M
0.00
6.00 M
12.00 M
18.00 M
Q3 '23
Q4 '23
Q1 '24
Q2 '24
Q3 '24
−15.00 M
0.00
15.00 M
30.00 M
45.00 M
Debt
Free cash flow
Cash & equivalents
No news here
Looks like there's nothing to report right now


Vivk long NASDAQ:VIVK
I like this as long as it doesn't fall below today's open. If it falls expect it to fill the gap down. This stock had a lot of volume today but not much volume recently. I like that the company is working toward dealing with climate change. I find very interesting the sensors in the

See all ideas
Summarizing what the indicators are suggesting.
Oscillators
Neutral
SellBuy
Strong sellStrong buy
Strong sellSellNeutralBuyStrong buy
Oscillators
Neutral
SellBuy
Strong sellStrong buy
Strong sellSellNeutralBuyStrong buy
Summary
Neutral
SellBuy
Strong sellStrong buy
Strong sellSellNeutralBuyStrong buy
Summary
Neutral
SellBuy
Strong sellStrong buy
Strong sellSellNeutralBuyStrong buy
Summary
Neutral
SellBuy
Strong sellStrong buy
Strong sellSellNeutralBuyStrong buy
Moving Averages
Neutral
SellBuy
Strong sellStrong buy
Strong sellSellNeutralBuyStrong buy
Moving Averages
Neutral
SellBuy
Strong sellStrong buy
Strong sellSellNeutralBuyStrong buy
Displays a symbol's price movements over previous years to identify recurring trends.
Frequently Asked Questions
The current price of VIVK is 0.9271 USD — it has increased by 1.88% in the past 24 hours. Watch Vivakor, Inc. stock price performance more closely on the chart.
Depending on the exchange, the stock ticker may vary. For instance, on NASDAQ exchange Vivakor, Inc. stocks are traded under the ticker VIVK.
VIVK stock has risen by 7.06% compared to the previous week, the month change is a 6.79% rise, over the last year Vivakor, Inc. has showed a 3.01% increase.
VIVK reached its all-time high on Sep 29, 2009 with the price of 2,039.0370 USD, and its all-time low was 0.0601 USD and was reached on Dec 27, 2011. View more price dynamics on VIVK chart.
See other stocks reaching their highest and lowest prices.
See other stocks reaching their highest and lowest prices.
VIVK stock is 10.96% volatile and has beta coefficient of 0.22. Track Vivakor, Inc. stock price on the chart and check out the list of the most volatile stocks — is Vivakor, Inc. there?
Today Vivakor, Inc. has the market capitalization of 37.32 M, it has increased by 8.09% over the last week.
Yes, you can track Vivakor, Inc. financials in yearly and quarterly reports right on TradingView.
Vivakor, Inc. is going to release the next earnings report on May 22, 2025. Keep track of upcoming events with our Earnings Calendar.
VIVK net income for the last quarter is −1.69 M USD, while the quarter before that showed −3.31 M USD of net income which accounts for 49.04% change. Track more Vivakor, Inc. financial stats to get the full picture.
No, VIVK doesn't pay any dividends to its shareholders. But don't worry, we've prepared a list of high-dividend stocks for you.
As of Mar 25, 2025, the company has 5.00 employees. See our rating of the largest employees — is Vivakor, Inc. on this list?
EBITDA measures a company's operating performance, its growth signifies an improvement in the efficiency of a company. Vivakor, Inc. EBITDA is −5.33 M USD, and current EBITDA margin is −4.04%. See more stats in Vivakor, Inc. financial statements.
Like other stocks, VIVK shares are traded on stock exchanges, e.g. Nasdaq, Nyse, Euronext, and the easiest way to buy them is through an online stock broker. To do this, you need to open an account and follow a broker's procedures, then start trading. You can trade Vivakor, Inc. stock right from TradingView charts — choose your broker and connect to your account.
Investing in stocks requires a comprehensive research: you should carefully study all the available data, e.g. company's financials, related news, and its technical analysis. So Vivakor, Inc. technincal analysis shows the buy rating today, and its 1 week rating is sell. Since market conditions are prone to changes, it's worth looking a bit further into the future — according to the 1 month rating Vivakor, Inc. stock shows the sell signal. See more of Vivakor, Inc. technicals for a more comprehensive analysis.
If you're still not sure, try looking for inspiration in our curated watchlists.
If you're still not sure, try looking for inspiration in our curated watchlists.