Target Price: S$2.37, indicating a 22.8% upsideStock Valuation and Outlook
Share Price (as of Feb 6, 2025): S$1.93
Target Price: S$2.37, indicating a 22.8% upside
Net Asset Value (NAV) per share: S$2.12
Projected DPU for 2025-2027:
2025F: 10.9 S cents
2026F: 11.2 S cents
2027F: 11.3 S cents
Dividend Yield: 5.6% (2025F), increasing to 5.8% by 202
CAPITALAND INTEGRATED COML TR MGMT LTD
1.74USDD
−0.18−9.37%
At close at Jul 11, 18:03 GMT
USD
No trades
Next report date
August 5
Report period
H1 2025
EPS estimate
—
Revenue estimate
628.84 M USD
0.10 USD
683.46 M USD
1.18 B USD
5.61 B
About CAPITALAND INTEGRATED COML TR MGMT LTD
Sector
Industry
CEO
Choon Siang Tan
Website
Headquarters
Singapore
Founded
2001
ISIN
SG1M51904654
FIGI
BBG000QT6JT8
CapitaLand Integrated Commercial Trust operates as a real estate investment trust, which engages in investments in income-producing assets for retail purposes. It operates through the following segments: Retail, Office, and Integrated Developments. The Retail segment manages the retail properties in Singapore. The Office segment includes management of office properties in Singapore and Germany. The Integrated Developments segment is involved in management of retail and office properties in Singapore. The company was founded on October 29, 2001 and is headquartered in Singapore.
40%
48%
56%
64%
72%
H2 '22
H1 '23
H2 '23
H1 '24
H2 '24
0.00
160.00 M
320.00 M
480.00 M
640.00 M
Revenue
Net income
Net margin %
Revenue
Op expenses
Op income
Int expenses
Non-op income/expenses
Pretax income
Taxes & Other
Net income
0.00
150.00 M
300.00 M
450.00 M
600.00 M
Revenue
Op expenses
Op income
Expenses & adjustments
Net income
0.00
150.00 M
300.00 M
450.00 M
600.00 M
No news here
Looks like there's nothing to report right now


C38U BUY/LONG NOW READY! 2.10 to 2.65 by End AUG/SEPT 2021TICKER CODE: C38U
Company Name: CAPLAND INTCOM T
Industry: FINANCE. REAL ESTATE INVESTMENT TRUSTS
Position Proposed: BUY/LONG (NOW READY!!)
BUY ENTRY: 2.00-2.10
1st Partial Take Profit: 2.65 (AUG 2021-SEPT 2021)
Potential 2nd Take Profit: 3.05 (END of 2021)
Stop Loss: 1.85
Technical An


Silver lining in retail sectorsRead about CCT here
You see, a retail mall is more than a place for people to get their groceries, dine out or send their kids for tuition. The Covi-19 has sent many retail players going bust and unable to pay their rents due to lack of sales. Some say, convert to online. It is easier said than d

C38U Possible Long SetupPrice is at a very respected trend line support (numerous touches), and in confluence with the 50EMA as support.
Bullish engulfing / tweezer bottom candlestick pattern formed at this level, adding to the bullish setup.
Stochastic indicator approaching the oversold area, suggesting further bullish

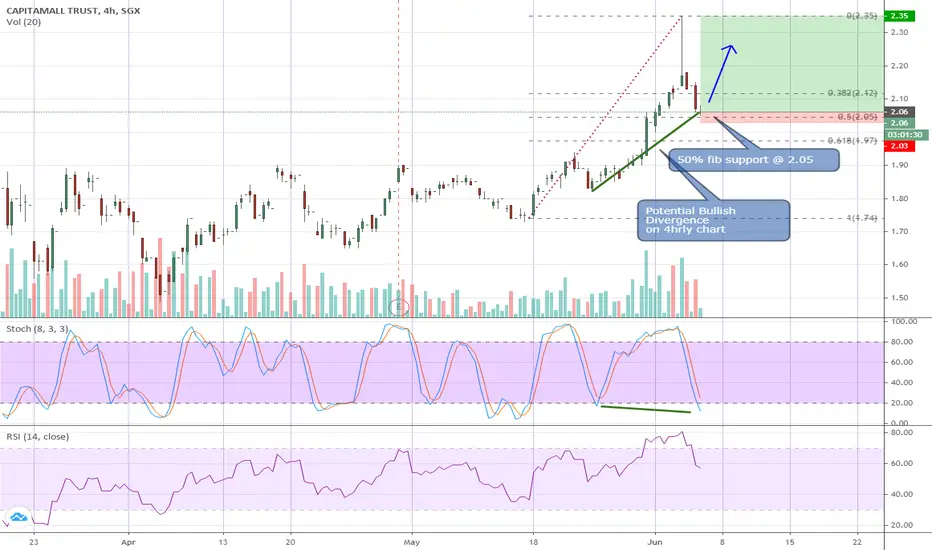
CapMall Trust - Time to stake for the ride up againCMT was pushed up quickly from 2.13 to 2.35 yesterday before crashing all the way back to 2.05 today. It appeared to find support at 2.05 which is also the 50% fib retracement of the swing up. A potential bullish divergence is also forming on the 4hrly chart. I would test the long here @ 2.05-2.0
CapitaMall Trust - Bullish divergence on dailyLong immediate at 1.72 (with stop loss just below 1.65) and short term upside to 1.89.
There is a chance an inverted H&S is setting up (longer term bullish if confirmed). Will revisit when it gets there.
Disclaimer: This is just my own analysis and opinion for discussion and is not a trade advi


See all ideas
Summarizing what the indicators are suggesting.
Neutral
SellBuy
Strong sellStrong buy
Strong sellSellNeutralBuyStrong buy
Neutral
SellBuy
Strong sellStrong buy
Strong sellSellNeutralBuyStrong buy
Neutral
SellBuy
Strong sellStrong buy
Strong sellSellNeutralBuyStrong buy
An aggregate view of professional's ratings.
Neutral
SellBuy
Strong sellStrong buy
Strong sellSellNeutralBuyStrong buy
Neutral
SellBuy
Strong sellStrong buy
Strong sellSellNeutralBuyStrong buy
Neutral
SellBuy
Strong sellStrong buy
Strong sellSellNeutralBuyStrong buy
Displays a symbol's price movements over previous years to identify recurring trends.