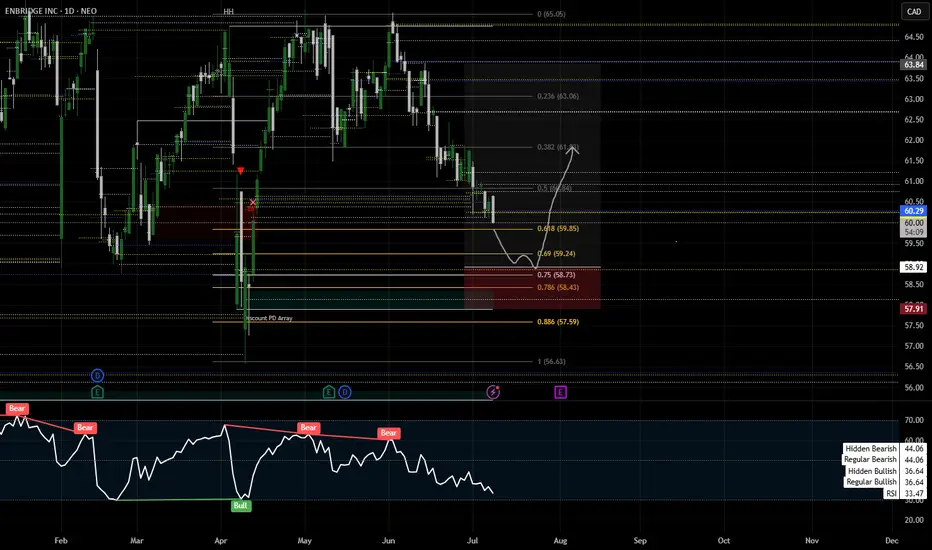
Enbridge long idea , with volume profilefib retracement
confluence with .75 rule and have daily order block
Next report date
August 1
Report period
Q2 2025
EPS estimate
0.43 USD
Revenue estimate
7.05 B USD
1.89 USD
3.78 B USD
37.24 B USD
2.18 B
About ENBRIDGE INC
Sector
Industry
CEO
Gregory Lorne Ebel
Website
Headquarters
Calgary
Founded
1949
FIGI
BBG005NR9W30
Enbridge, Inc. engages in the provision of gas and oil. It operates through the following segments: Liquid Pipelines, Gas Distribution and Storage, Gas Transmission and Midstream, Renewable Power Generation, and Energy Services. The Liquids Pipelines segment consists of common carrier and contract crude oil, natural gas liquids and refined products pipelines and terminals in Canada and the U.S., including Canadian Mainline, Regional Oil Sands System, Southern Lights Pipeline, Spearhead Pipeline, Seaway Crude Pipeline interest, and other feeder pipelines. The Gas Distribution & Storage segment consists of natural gas utility operations, the core of which is Enbridge gas, which serves residential, commercial and industrial customers. It also includes natural gas distribution activities in Quebec and an investment in Noverco, which holds a majority interest in a subsidiary entity engaged in distribution and energy transportation primarily in Quebec. The Gas Transmission & Midstream segment consists of investments in natural gas pipelines, processing and green energy projects, the company's commodity marketing businesses, and international activities. The Renewable Power Generation segment consists primarily of investments in wind and solar power generating assets, as well as geothermal, waste heat recovery, and transmission assets. The Energy Services segment consists of businesses in Canada and the United States including logistical services, refinery supply services and the firm's volume commitments on various pipeline systems. The company was founded on April 30, 1949 and is headquartered in Calgary, Canada.
3.5%
7.5%
11.5%
15.5%
19.5%
Q1 '24
Q2 '24
Q3 '24
Q4 '24
Q1 '25
0.00
3.50 B
7.00 B
10.50 B
14.00 B
Revenue
Net income
Net margin %
Revenue
COGS
Gross profit
Op expenses
Op income
Non-Op income/ expenses
Taxes & Other
Net income
0.00
3.50 B
7.00 B
10.50 B
14.00 B
Revenue
COGS
Gross profit
Expenses & adjustments
Net income
0.00
3.50 B
7.00 B
10.50 B
14.00 B
Q1 '24
Q2 '24
Q3 '24
Q4 '24
Q1 '25
0.00
20.00 B
40.00 B
60.00 B
80.00 B
Debt
Free cash flow
Cash & equivalents
No news here
Looks like there's nothing to report right now


Enbridge Setting Up For An Inside Bar Entry On A PullbackWe are going back to well after previously recommending TSX:ENB in one of my other one good trade videos. In this video, I cover the concept of swing trading pullbacks. I got into depth of the price action on the pullback and I explain where I would put my stop and take profit.


Buy ENB - 5th wave pivot identifiedPrice reversal and pivot from the end of wave 4. Buying with 1% allocation. Open @ 34 34 TP @ 37.25 (+8.5%)
Strategy:
Based on Elliot wave theory, pivot points and classic chart patterns.The 5th wave pivot strategy identifies the last impulse of the elliot wave sequence. The 5th wave can be equal


See all ideas
Displays a symbol's price movements over previous years to identify recurring trends.
ENB5654185
Enbridge Inc. 8.25% 15-JAN-2084Yield to maturity
7.69%
Maturity date
Jan 15, 2084
ENB5654186
Enbridge Inc. 8.5% 15-JAN-2084Yield to maturity
7.37%
Maturity date
Jan 15, 2084
ENB5210532
Enbridge Inc. 3.4% 01-AUG-2051Yield to maturity
7.33%
Maturity date
Aug 1, 2051
ENB5477193
Enbridge Inc. 7.375% 15-JAN-2083Yield to maturity
7.11%
Maturity date
Jan 15, 2083
ENB5477194
Enbridge Inc. 7.625% 15-JAN-2083Yield to maturity
7.08%
Maturity date
Jan 15, 2083
ENB4912103
Enbridge Inc. 4.0% 15-NOV-2049Yield to maturity
7.03%
Maturity date
Nov 15, 2049
ENB5838261
Enbridge Inc. 7.375% 15-MAR-2055Yield to maturity
6.90%
Maturity date
Mar 15, 2055
ENB5838262
Enbridge Inc. 7.2% 27-JUN-2054Yield to maturity
6.88%
Maturity date
Jun 27, 2054
ENB4130833
Enbridge Inc. 4.5% 10-JUN-2044Yield to maturity
6.68%
Maturity date
Jun 10, 2044
See all ENBRF bonds
Curated watchlists where ENBRF is featured.

Frequently Asked Questions
The current price of ENBRF is 13.87 USD — it hasn't changed in the past 24 hours. Watch Enbridge Inc. stock price performance more closely on the chart.
Depending on the exchange, the stock ticker may vary. For instance, on OTC exchange Enbridge Inc. stocks are traded under the ticker ENBRF.
ENBRF reached its all-time high on Dec 10, 2024 with the price of 14.09 USD, and its all-time low was 11.44 USD and was reached on Dec 29, 2022. View more price dynamics on ENBRF chart.
See other stocks reaching their highest and lowest prices.
See other stocks reaching their highest and lowest prices.
ENBRF stock is 0.00% volatile and has beta coefficient of 0.33. Track Enbridge Inc. stock price on the chart and check out the list of the most volatile stocks — is Enbridge Inc. there?
Today Enbridge Inc. has the market capitalization of 98.43 B, it has decreased by −1.99% over the last week.
Yes, you can track Enbridge Inc. financials in yearly and quarterly reports right on TradingView.
Enbridge Inc. is going to release the next earnings report on Aug 1, 2025. Keep track of upcoming events with our Earnings Calendar.
ENBRF earnings for the last quarter are 0.72 USD per share, whereas the estimation was 0.67 USD resulting in a 7.08% surprise. The estimated earnings for the next quarter are 0.43 USD per share. See more details about Enbridge Inc. earnings.
Enbridge Inc. revenue for the last quarter amounts to 12.86 B USD, despite the estimated figure of 8.04 B USD. In the next quarter, revenue is expected to reach 7.05 B USD.
ENBRF net income for the last quarter is 1.64 B USD, while the quarter before that showed 413.47 M USD of net income which accounts for 297.28% change. Track more Enbridge Inc. financial stats to get the full picture.
Yes, ENBRF dividends are paid quarterly. The last dividend per share was 0.27 USD. As of today, Dividend Yield (TTM)% is 6.00%. Tracking Enbridge Inc. dividends might help you take more informed decisions.
Enbridge Inc. dividend yield was 6.00% in 2024, and payout ratio reached 156.31%. The year before the numbers were 7.44% and 125.12% correspondingly. See high-dividend stocks and find more opportunities for your portfolio.
As of Jul 16, 2025, the company has 14.5 K employees. See our rating of the largest employees — is Enbridge Inc. on this list?
EBITDA measures a company's operating performance, its growth signifies an improvement in the efficiency of a company. Enbridge Inc. EBITDA is 11.37 B USD, and current EBITDA margin is 28.31%. See more stats in Enbridge Inc. financial statements.
Like other stocks, ENBRF shares are traded on stock exchanges, e.g. Nasdaq, Nyse, Euronext, and the easiest way to buy them is through an online stock broker. To do this, you need to open an account and follow a broker's procedures, then start trading. You can trade Enbridge Inc. stock right from TradingView charts — choose your broker and connect to your account.