IAG supply zonePrice arriving into supply zone.
will monitor from daily chart, h4/daily only
interested to see if 9.19 level will be reached ? or if any fake upside breaks?
and or how price behaves around highs.
short side catches my interest only if PA and structure builds right .
will wait for sell
Insurance Australia Group Ltd.
27.87USDD
−1.13−3.91%
At close at Jul 10, 19:27 GMT
USD
No trades
Next report date
August 13
Report period
H2 2025
EPS estimate
0.71 USD
Revenue estimate
5.69 B USD
1.76 USD
588.45 M USD
10.70 B USD
About INSURANCE AUSTRALIA GROUP LIMITED
Sector
Industry
CEO
Nicholas Barrie Hawkins
Website
Headquarters
Sydney
Founded
1999
FIGI
BBG000RJYH30
Insurance Australia Group Ltd. engages in underwriting of general insurance and related corporate services. It operates through the following business divisions: Direct Insurance Australia, Intermediated Insurance Australia, New Zealand, and Corporate and Other. The Direct Insurance Australia division provides personal lines, some commercial lines, and general insurance products sold to customers under the NRMA, SGIO, SGIC, the RACV in Victoria, as well as the CGU and Poncho brands. The Intermediated Insurance Australia division offers commercial lines, personal lines, and general insurance products sold to customers through intermediaries including brokers, authorized representatives, and distribution partners under the CGU and WFI brands, as well as the Coles insurance brand via a distribution agreement with Coles. The New Zealand division deals with general insurance products underwritten in New Zealand. The Corporate and Other division represents other activities, including corporate services, capital management activity, shareholders’ funds investment activities, inward reinsurance from associates, investment in associates, and other businesses that offer products and services that are adjacent to IAG's insurance business. The company was founded in 1925 and is headquartered Sydney, Australia.
4.5%
5.6%
6.7%
7.8%
8.9%
H1 '23
H2 '23
H1 '24
H2 '24
H1 '25
0.00
1.50 B
3.00 B
4.50 B
6.00 B
Revenue
Net income
Net margin %
Revenue
Total operating expenses
Op income
Non-operating income
Pretax income
Taxes & Other
Net income
0.00
1.50 B
3.00 B
4.50 B
6.00 B
Revenue
Total operating expenses
Op income
Expenses & adjustments
Net income
0.00
1.50 B
3.00 B
4.50 B
6.00 B
Insurance reserves, claims and premiums
H1 '23
H2 '23
H1 '24
H2 '24
H1 '25
0.00
2.50 B
5.00 B
7.50 B
10.00 B
Insurance reserves
Policy claims
Premium earned
No news here
Looks like there's nothing to report right now


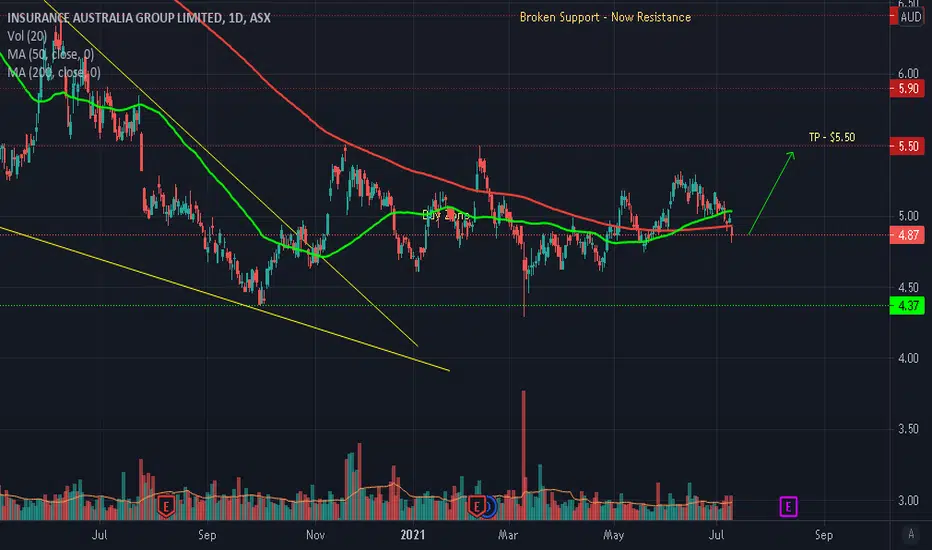
IAG - Bullish Trade PlanIAG has pulled back towards its 200 SMA and has currently found support. I expect price to consolidate a bit before moving higher and this could be a very good buying opportunity. I will enter a long position once bullish price action is confirmed in the very zone. Lets see how it develops.
Please

IAG - Trade PlanIAG is currently pulling back and I expect that this pull back may provide a good buying opportunity. I will take a long position once it prints bullish price action and targeting the recent highs around $5.50. My stoploss will be below the current swing low.
Please note these are my own notes, by
Insurance Australia GroupEquity Portfolio Technical View
The share is setting up a potential long term bullish reversal, with it’s 16-month downward trend line breached as per the weekly chart.
New 3 1/2 month high.
Weekly RSI emerging from a neutral regime, shifting to a bullish regime, with a reading of 56.
Weekly RSI


See all ideas
Summarizing what the indicators are suggesting.
Neutral
SellBuy
Strong sellStrong buy
Strong sellSellNeutralBuyStrong buy
Neutral
SellBuy
Strong sellStrong buy
Strong sellSellNeutralBuyStrong buy
Neutral
SellBuy
Strong sellStrong buy
Strong sellSellNeutralBuyStrong buy
An aggregate view of professional's ratings.
Neutral
SellBuy
Strong sellStrong buy
Strong sellSellNeutralBuyStrong buy
Neutral
SellBuy
Strong sellStrong buy
Strong sellSellNeutralBuyStrong buy
Neutral
SellBuy
Strong sellStrong buy
Strong sellSellNeutralBuyStrong buy
Displays a symbol's price movements over previous years to identify recurring trends.