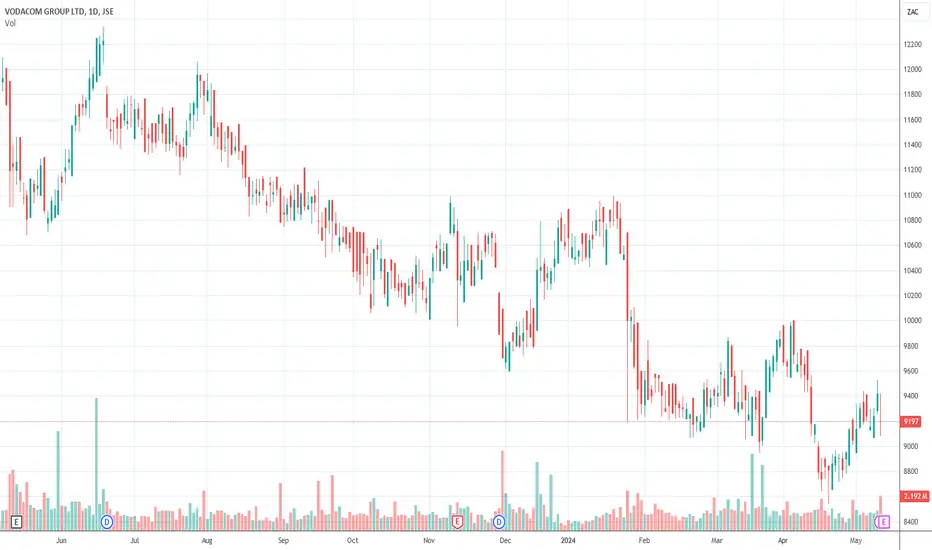
I am expecting a bullish runFrom 2022 to mid 2024 around July we had a bearish run we kept maintaining bearish order flow. Until we had order flow disruption to the upside which is the first indication of the bulls taking control and second confirmation was the unwillingness to the downside followed by bullish break of struc
Next report date
May 19
Report period
H2 2024
EPS estimate
0.27 USD
Revenue estimate
4.19 B USD
0.44 USD
855.33 M USD
7.83 B USD
551.93 M
About VODACOM GROUP LTD
Sector
Industry
CEO
Mohamed Shameel Aziz-Joosub
Website
Headquarters
Midrand
Founded
1993
ISIN
ZAE000132577
FIGI
BBG00369SDQ0
Vodacom Group Ltd. engages in the provision of communications products and services. Its businesses include Vodacom Business Africa and Carrier Services. The company was founded in 1993 and is headquartered in Midrand, South Africa.
9.0%
10.5%
12.0%
13.5%
15.0%
H1 '22
H2 '22
H1 '23
H2 '23
H1 '24
0.00
1.10 B
2.20 B
3.30 B
4.40 B
Revenue
Net income
Net margin %
Revenue
COGS
Gross profit
Op expenses
Op income
Non-Op income/ expenses
Taxes & Other
Net income
0.00
1.10 B
2.20 B
3.30 B
4.40 B
Revenue
COGS
Gross profit
Expenses & adjustments
Net income
0.00
1.10 B
2.20 B
3.30 B
4.40 B
H1 '22
H2 '22
H1 '23
H2 '23
H1 '24
0.00
1.10 B
2.20 B
3.30 B
4.40 B
Debt
Free cash flow
Cash & equivalents
No news here
Looks like there's nothing to report right now

Our opinion on the current state of VODACOM(VOD)Vodacom (VOD) is South Africa's largest airtime and data provider for cell phones. It is a subsidiary of the international company Vodaphone. Its competitors are MTN, Cell-C, and Telkom.
The cell phone industry has been hammered by a steady decline in voice revenue, which has to some extent been

Our opinion on the current state of VODACOM(VOD)Vodacom (VOD) is South Africa's largest provider of airtime and data services for mobile phones. It operates as a subsidiary of the international telecom company Vodafone. Its main competitors include MTN, Cell-C, and Telkom. The mobile industry has faced continuous pressure from declining voice rev

Our opinion on the current state of VODACOM(VOD)Vodacom (VOD) remains a key player in South Africa's telecommunications industry and holds a dominant position in the market as the largest provider of mobile airtime and data services. As a subsidiary of Vodafone, Vodacom benefits from the backing of a global telecommunications giant but also faces

Probabilities of further upside on JSE's Vodacom share price?JSEVOD fell off a cliff from its all-time high of R186.99 in August 2017 and left a gap between R177.10 and R168.81 while going on a downward trajectory, reaching lows of R90.70 around March 2020. We then saw a bounce rally taking us to R163.48 before sellers stepped in around April 2022 to have pri

Vodacom showing strong upside after CUp break to R140.37Cup and Handle has formed on the daily.
The pattern has formed since May 2023 and only now recently it's broken up.
SO this is a massive analysis and a High probability analysis whiich is likely to work out.
Also the Price>20 and 200
So the first major target is at R140.37

Our opinion on the current state of VODACOM(VOD)Vodacom (VOD) is South Africa's largest airtime and data provider for cell phones. It is a subsidiary of the international company Vodafone. Its competitors are MTN, Cell-C, and Telkom. The cell phone industry has been hammered by a steady decline in voice revenue which has to some extent been compe

$JSEVOD - Vodacom: Potential Double Bottom ReversalSee link below for previous analysis.
Vodacom selling momentum looks to have tapered as the MACD has given a strong bullish convergence pattern.
I am also on the lookout for a potential double bottom pattern between the 9070 to 8544 zone.
It is still too early to call a reversal but i will monitor

Our opinion on the current state of VODACOM(VOD)Vodacom, as South Africa's largest provider of airtime and data for cell phones, plays a crucial role in the telecom sector. It operates as a subsidiary of the international conglomerate Vodafone, facing competition from MTN, Cell-C, and Telkom. The industry has seen a significant shift with a decli
VODACOM GROUP (VOD)They are down nearly 40% since its peak in March 2022. This pullback mirrors similar trends observed in other South African Inc stocks. Currently, the share price has retreated to the lower trend line that has been established since 2022, finding support at R86.50. This pullback may potentially posi

See all ideas
Summarizing what the indicators are suggesting.
Neutral
SellBuy
Strong sellStrong buy
Strong sellSellNeutralBuyStrong buy
Neutral
SellBuy
Strong sellStrong buy
Strong sellSellNeutralBuyStrong buy
Neutral
SellBuy
Strong sellStrong buy
Strong sellSellNeutralBuyStrong buy
An aggregate view of professional's ratings.
Neutral
SellBuy
Strong sellStrong buy
Strong sellSellNeutralBuyStrong buy
Neutral
SellBuy
Strong sellStrong buy
Strong sellSellNeutralBuyStrong buy
Neutral
SellBuy
Strong sellStrong buy
Strong sellSellNeutralBuyStrong buy
Displays a symbol's price movements over previous years to identify recurring trends.
Frequently Asked Questions
The current price of VODAF is 5.75 USD — it hasn't changed in the past 24 hours. Watch Vodacom Group Ltd. stock price performance more closely on the chart.
Depending on the exchange, the stock ticker may vary. For instance, on OTC exchange Vodacom Group Ltd. stocks are traded under the ticker VODAF.
We've gathered analysts' opinions on Vodacom Group Ltd. future price: according to them, VODAF price has a max estimate of 7.54 USD and a min estimate of 5.53 USD. Watch VODAF chart and read a more detailed Vodacom Group Ltd. stock forecast: see what analysts think of Vodacom Group Ltd. and suggest that you do with its stocks.
VODAF reached its all-time high on Jan 30, 2013 with the price of 13.65 USD, and its all-time low was 4.99 USD and was reached on Mar 19, 2024. View more price dynamics on VODAF chart.
See other stocks reaching their highest and lowest prices.
See other stocks reaching their highest and lowest prices.
VODAF stock is 0.00% volatile and has beta coefficient of 0.93. Track Vodacom Group Ltd. stock price on the chart and check out the list of the most volatile stocks — is Vodacom Group Ltd. there?
Today Vodacom Group Ltd. has the market capitalization of 13.10 B, it has decreased by −0.12% over the last week.
Yes, you can track Vodacom Group Ltd. financials in yearly and quarterly reports right on TradingView.
Vodacom Group Ltd. is going to release the next earnings report on May 19, 2025. Keep track of upcoming events with our Earnings Calendar.
VODAF earnings for the last half-year are 0.20 USD per share, whereas the estimation was 0.24 USD, resulting in a −15.51% surprise. The estimated earnings for the next half-year are 0.27 USD per share. See more details about Vodacom Group Ltd. earnings.
Vodacom Group Ltd. revenue for the last half-year amounts to 4.24 B USD, despite the estimated figure of 4.23 B USD. In the next half-year revenue is expected to reach 4.19 B USD.
VODAF net income for the last half-year is 394.84 M USD, while the previous report showed 415.12 M USD of net income which accounts for −4.88% change. Track more Vodacom Group Ltd. financial stats to get the full picture.
Vodacom Group Ltd. dividend yield was 5.99% in 2023, and payout ratio reached 70.03%. The year before the numbers were 5.49% and 70.68% correspondingly. See high-dividend stocks and find more opportunities for your portfolio.
As of Apr 18, 2025, the company has 8.13 K employees. See our rating of the largest employees — is Vodacom Group Ltd. on this list?
EBITDA measures a company's operating performance, its growth signifies an improvement in the efficiency of a company. Vodacom Group Ltd. EBITDA is 3.09 B USD, and current EBITDA margin is 35.41%. See more stats in Vodacom Group Ltd. financial statements.
Like other stocks, VODAF shares are traded on stock exchanges, e.g. Nasdaq, Nyse, Euronext, and the easiest way to buy them is through an online stock broker. To do this, you need to open an account and follow a broker's procedures, then start trading. You can trade Vodacom Group Ltd. stock right from TradingView charts — choose your broker and connect to your account.
Investing in stocks requires a comprehensive research: you should carefully study all the available data, e.g. company's financials, related news, and its technical analysis. So Vodacom Group Ltd. technincal analysis shows the sell today, and its 1 week rating is sell. Since market conditions are prone to changes, it's worth looking a bit further into the future — according to the 1 month rating Vodacom Group Ltd. stock shows the sell signal. See more of Vodacom Group Ltd. technicals for a more comprehensive analysis.
If you're still not sure, try looking for inspiration in our curated watchlists.
If you're still not sure, try looking for inspiration in our curated watchlists.