NASDAQ ShortLooking for the short on Nasdaq been trading this long and short through out the week. Check the linked publications. Shouted out 22,000 before seeing the short.
NAS100 trade ideas


My trade idea on NASDAQ 100 For the coming week I'm seeing NAS100 dropping lower to pull/draw on liquidity below there heading to where we have what looks like a strong POI...
Drop your comment below if you're seeing something totally different from what I'm seeing here and lets have a discussion about our views.


NASDAQ Pullback or Reversal? Watching 4H Support ZonePrice is reacting from the 1D resistance zone around 21,950 and now hovering near a 4H support zone at ~21,520.
• 1D Chart: Long wick rejection from resistance.
• 4H Chart: Break of rising wedge and rejection from 1H trendline.
• 1H & 23m Chart: Clear bearish order block formed. Price consolidating under broken structure.
Key Zones:
• Support: 21,500 / 21,325
• Resistance: 21,900 / 22,000
Bias: Bearish below 21,750. Retest of support expected.
NSDQ100 uptrend consolidation supported at 21300Markets Rattled After Israel Strikes Iran
Israel launched major airstrikes on Iran, targeting nuclear and missile sites, as well as top military leaders. The move sharply escalates tensions in the Middle East and came despite warnings from former President Donald Trump, who was told of the attack only shortly beforehand. He later warned Iran that future strikes would be “even more brutal” if no deal is made.
Market Reaction:
Oil jumped up to 13% on fears of supply disruptions.
Gold climbed as investors rushed to safe-haven assets.
Stock futures and crypto fell on rising geopolitical risk.
The U.S. dollar dipped, then rebounded, as its role as a safe-haven asset came into focus.
Other Key Updates:
Trump wins court backing to keep troops in Los Angeles amid ongoing protests. A hearing is set for Tuesday.
Meta invests billions in Scale AI, bringing on its CEO to boost efforts in building artificial general intelligence. Meta is aggressively hiring top AI talent from firms like Google.
For Traders:
Watch oil and gold closely for continued volatility.
Safe-haven flows could drive further USD and gold moves.
Meta’s AI push may influence tech sector sentiment.
Key Support and Resistance Levels
Resistance Level 1: 22070
Resistance Level 2: 22370
Resistance Level 3: 22680
Support Level 1: 21300
Support Level 2: 21060
Support Level 3: 20820
This communication is for informational purposes only and should not be viewed as any form of recommendation as to a particular course of action or as investment advice. It is not intended as an offer or solicitation for the purchase or sale of any financial instrument or as an official confirmation of any transaction. Opinions, estimates and assumptions expressed herein are made as of the date of this communication and are subject to change without notice. This communication has been prepared based upon information, including market prices, data and other information, believed to be reliable; however, Trade Nation does not warrant its completeness or accuracy. All market prices and market data contained in or attached to this communication are indicative and subject to change without notice.

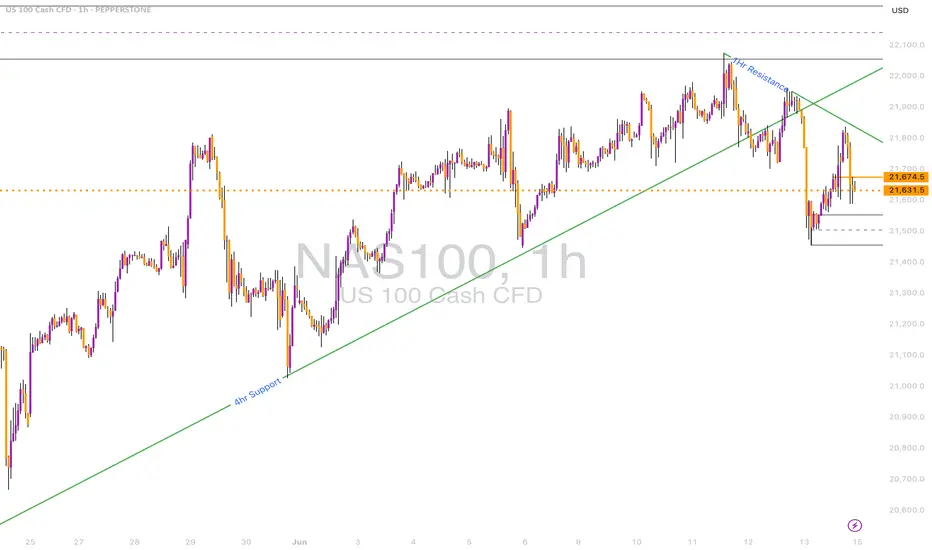
USNAS100 – Bearish Bias Below 21780 Ahead of CPI and Trade TalksUSNAS100 – Bearish Pressure Below 21780, CPI & Trade Talks in Focus
Overview:
USNAS100 remains under downward pressure ahead of a key macro week, including US-China trade talks and the upcoming US CPI data.
Technically, price remains bearish while below the pivot level at 21780.
A break below 21635 may lead to further downside toward 21470 and potentially 21360.
On the upside, a 1H close above 21780 could invalidate the bearish view and open the path toward 21920 and the ATH at 22200.
Key Levels:
Pivot: 21780
Support: 21635, 21470, 21360
Resistance: 21920, 22200

Bullish continuation?USTEC is falling towards the pivot and could bounce to the 1st resistance.
Pivot: 21,115.24
1st Support: 20,647.83
1st Resistance: 22,217.62
Risk Warning:
Trading Forex and CFDs carries a high level of risk to your capital and you should only trade with money you can afford to lose. Trading Forex and CFDs may not be suitable for all investors, so please ensure that you fully understand the risks involved and seek independent advice if necessary.
Disclaimer:
The above opinions given constitute general market commentary, and do not constitute the opinion or advice of IC Markets or any form of personal or investment advice.
Any opinions, news, research, analyses, prices, other information, or links to third-party sites contained on this website are provided on an "as-is" basis, are intended only to be informative, is not an advice nor a recommendation, nor research, or a record of our trading prices, or an offer of, or solicitation for a transaction in any financial instrument and thus should not be treated as such. The information provided does not involve any specific investment objectives, financial situation and needs of any specific person who may receive it. Please be aware, that past performance is not a reliable indicator of future performance and/or results. Past Performance or Forward-looking scenarios based upon the reasonable beliefs of the third-party provider are not a guarantee of future performance. Actual results may differ materially from those anticipated in forward-looking or past performance statements. IC Markets makes no representation or warranty and assumes no liability as to the accuracy or completeness of the information provided, nor any loss arising from any investment based on a recommendation, forecast or any information supplied by any third-party.

US100Correlation Between US100 (Nasdaq 100), 10-Year Bond Yield, and Bond Prices
1. Relationship Between 10-Year Treasury Bond Yield and Bond Prices
Inverse Relationship:
Bond prices and yields move inversely. When the 10-year Treasury yield rises, bond prices fall, and vice versa. This is because the fixed coupon payments become less attractive when yields increase, causing existing bond prices to drop to offer comparable yields to new issues.
Current Data (June 13, 2025):
10-Year Treasury yield is around 4.40%, with the bond price near 98.81 (below par), reflecting recent yield increases.
Term Premium:
The term premium on the 10-year Treasury has risen sharply since early April 2025, reaching the highest level in over a decade. This premium compensates investors for risks that short-term yields may not evolve as expected, keeping long-term yields elevated and bond prices suppressed.
2. US100 (Nasdaq 100) and 10-Year Treasury Yield Correlation
Negative Correlation Generally Observed:
The Nasdaq 100 (US100), a tech-heavy equity index, often shows a negative correlation with 10-year Treasury yields. When yields rise, borrowing costs increase, discount rates for future earnings rise, and equities—especially growth stocks—tend to decline. Conversely, falling yields often boost equities.
Recent Trends:
In 2025, rising yields have put pressure on equities, including the Nasdaq 100, as investors demand higher returns from riskier assets. However, periods of yield stabilization or decline can support equity rallies.
Risk Sentiment:
The correlation can vary with market sentiment; during risk-off episodes, both equities and bond yields may fall as investors flock to safety.
3. US100 and Bond Prices
Indirect Relationship via Yields:
Since bond prices move inversely to yields, and yields often move inversely to equities, bond prices and equities like US100 often show a positive correlation in risk-off environments (both falling) and a negative correlation in risk-on environments (equities rising, bond prices falling).
Safe-Haven Demand:
In times of market stress, investors may sell equities and buy bonds, pushing bond prices up and yields down, while equities like US100 decline.
4. Yield Curve and Market Implications
The US yield curve has steepened recently, with the 10-year yield (~4.40%) above the 2-year yield (~3.95%), reflecting expectations of higher long-term inflation and growth risks.
A steepening curve can signal improving growth prospects but also higher financing costs, which can weigh on tech stocks in the US100.
Conclusion
The 10-year Treasury yield and bond prices move inversely, with recent yield increases pushing bond prices below par.
The Nasdaq 100 (US100) typically moves inversely to 10-year yields, as higher yields raise borrowing costs and discount rates, pressuring growth stocks.
The relationship between US100 and bond prices depends on market risk sentiment: in risk-off periods, bond prices rise while equities fall; in risk-on periods, the opposite occurs.
The current steepening yield curve and elevated term premium suggest ongoing volatility and cautious investor positioning affecting both bonds and equities.
#NAS100 #DOLLAR


NAS100 ATH or what? optimism coming back or no? Chyna CHyna CHyNAS100 ATH or what?
optimism coming back or no? Chyna CHyna CHyna? or no CHyna? let us know~~
we caught april bottom now run ATH?
🐉We value full transparency. All wins and fails fully publicized, zero edit, zero delete, zero fakes.🐉
🐉Check out our socials for some nice insights.🐉
information created and published doesn't constitute investment advice!
NOT financial advice

Nasdaq-100 H1 | Potential bullish bounce off 50% Fibo support?The Nasdaq-100 (NAS100) is falling towards a pullback support and could potentially bounce off this level to climb higher.
Buy entry is at 21,703.02 which is a pullback support that aligns with the 50.0% Fibonacci retracement.
Stop loss is at 21,400.00 which is a level that lies underneath a swing-low support and the 50.0% Fibonacci retracement.
Take profit is at 22,022.32 which is a resistance that aligns with the 127.2% Fibonacci extension.
High Risk Investment Warning
Trading Forex/CFDs on margin carries a high level of risk and may not be suitable for all investors. Leverage can work against you.
Stratos Markets Limited (tradu.com ):
CFDs are complex instruments and come with a high risk of losing money rapidly due to leverage. 63% of retail investor accounts lose money when trading CFDs with this provider. You should consider whether you understand how CFDs work and whether you can afford to take the high risk of losing your money.
Stratos Europe Ltd (tradu.com ):
CFDs are complex instruments and come with a high risk of losing money rapidly due to leverage. 63% of retail investor accounts lose money when trading CFDs with this provider. You should consider whether you understand how CFDs work and whether you can afford to take the high risk of losing your money.
Stratos Global LLC (tradu.com ):
Losses can exceed deposits.
Please be advised that the information presented on TradingView is provided to Tradu (‘Company’, ‘we’) by a third-party provider (‘TFA Global Pte Ltd’). Please be reminded that you are solely responsible for the trading decisions on your account. There is a very high degree of risk involved in trading. Any information and/or content is intended entirely for research, educational and informational purposes only and does not constitute investment or consultation advice or investment strategy. The information is not tailored to the investment needs of any specific person and therefore does not involve a consideration of any of the investment objectives, financial situation or needs of any viewer that may receive it. Kindly also note that past performance is not a reliable indicator of future results. Actual results may differ materially from those anticipated in forward-looking or past performance statements. We assume no liability as to the accuracy or completeness of any of the information and/or content provided herein and the Company cannot be held responsible for any omission, mistake nor for any loss or damage including without limitation to any loss of profit which may arise from reliance on any information supplied by TFA Global Pte Ltd.
The speaker(s) is neither an employee, agent nor representative of Tradu and is therefore acting independently. The opinions given are their own, constitute general market commentary, and do not constitute the opinion or advice of Tradu or any form of personal or investment advice. Tradu neither endorses nor guarantees offerings of third-party speakers, nor is Tradu responsible for the content, veracity or opinions of third-party speakers, presenters or participants.

US100Correlation Between US100 (Nasdaq 100), 10-Year Bond Yield, and Bond Prices
1. Relationship Between 10-Year Treasury Bond Yield and Bond Prices
Inverse Relationship:
Bond prices and yields move inversely. When the 10-year Treasury yield rises, bond prices fall, and vice versa. This is because the fixed coupon payments become less attractive when yields increase, causing existing bond prices to drop to offer comparable yields to new issues.
Current Data (June 13, 2025):
10-Year Treasury yield is around 4.40%, with the bond price near 98.81 (below par), reflecting recent yield increases.
Term Premium:
The term premium on the 10-year Treasury has risen sharply since early April 2025, reaching the highest level in over a decade. This premium compensates investors for risks that short-term yields may not evolve as expected, keeping long-term yields elevated and bond prices suppressed.
2. US100 (Nasdaq 100) and 10-Year Treasury Yield Correlation
Negative Correlation Generally Observed:
The Nasdaq 100 (US100), a tech-heavy equity index, often shows a negative correlation with 10-year Treasury yields. When yields rise, borrowing costs increase, discount rates for future earnings rise, and equities—especially growth stocks—tend to decline. Conversely, falling yields often boost equities.
Recent Trends:
In 2025, rising yields have put pressure on equities, including the Nasdaq 100, as investors demand higher returns from riskier assets. However, periods of yield stabilization or decline can support equity rallies.
Risk Sentiment:
The correlation can vary with market sentiment; during risk-off episodes, both equities and bond yields may fall as investors flock to safety.
3. US100 and Bond Prices
Indirect Relationship via Yields:
Since bond prices move inversely to yields, and yields often move inversely to equities, bond prices and equities like US100 often show a positive correlation in risk-off environments (both falling) and a negative correlation in risk-on environments (equities rising, bond prices falling).
Safe-Haven Demand:
In times of market stress, investors may sell equities and buy bonds, pushing bond prices up and yields down, while equities like US100 decline.
4. Yield Curve and Market Implications
The US yield curve has steepened recently, with the 10-year yield (~4.40%) above the 2-year yield (~3.95%), reflecting expectations of higher long-term inflation and growth risks.
A steepening curve can signal improving growth prospects but also higher financing costs, which can weigh on tech stocks in the US100.
Conclusion
The 10-year Treasury yield and bond prices move inversely, with recent yield increases pushing bond prices below par.
The Nasdaq 100 (US100) typically moves inversely to 10-year yields, as higher yields raise borrowing costs and discount rates, pressuring growth stocks.
The relationship between US100 and bond prices depends on market risk sentiment: in risk-off periods, bond prices rise while equities fall; in risk-on periods, the opposite occurs.
The current steepening yield curve and elevated term premium suggest ongoing volatility and cautious investor positioning affecting both bonds and equities.
#NAS100 #DOLLAR

Nasdaq-100 H1 | Approaching a pullback resistanceThe Nasdaq-100 (NAS100) is rising towards a pullback resistance and could potentially reverse off this level to drop lower.
Sell entry is at 21,719.73 which is a pullback resistance.
Stop loss is at 21,870.00 which is a level that sits above the 78.6% Fibonacci retracement and a swing-high resistance.
Take profit is at 21,477.88 which is a multi-swing-low support.
High Risk Investment Warning
Trading Forex/CFDs on margin carries a high level of risk and may not be suitable for all investors. Leverage can work against you.
Stratos Markets Limited (tradu.com ):
CFDs are complex instruments and come with a high risk of losing money rapidly due to leverage. 63% of retail investor accounts lose money when trading CFDs with this provider. You should consider whether you understand how CFDs work and whether you can afford to take the high risk of losing your money.
Stratos Europe Ltd (tradu.com ):
CFDs are complex instruments and come with a high risk of losing money rapidly due to leverage. 63% of retail investor accounts lose money when trading CFDs with this provider. You should consider whether you understand how CFDs work and whether you can afford to take the high risk of losing your money.
Stratos Global LLC (tradu.com ):
Losses can exceed deposits.
Please be advised that the information presented on TradingView is provided to Tradu (‘Company’, ‘we’) by a third-party provider (‘TFA Global Pte Ltd’). Please be reminded that you are solely responsible for the trading decisions on your account. There is a very high degree of risk involved in trading. Any information and/or content is intended entirely for research, educational and informational purposes only and does not constitute investment or consultation advice or investment strategy. The information is not tailored to the investment needs of any specific person and therefore does not involve a consideration of any of the investment objectives, financial situation or needs of any viewer that may receive it. Kindly also note that past performance is not a reliable indicator of future results. Actual results may differ materially from those anticipated in forward-looking or past performance statements. We assume no liability as to the accuracy or completeness of any of the information and/or content provided herein and the Company cannot be held responsible for any omission, mistake nor for any loss or damage including without limitation to any loss of profit which may arise from reliance on any information supplied by TFA Global Pte Ltd.
The speaker(s) is neither an employee, agent nor representative of Tradu and is therefore acting independently. The opinions given are their own, constitute general market commentary, and do not constitute the opinion or advice of Tradu or any form of personal or investment advice. Tradu neither endorses nor guarantees offerings of third-party speakers, nor is Tradu responsible for the content, veracity or opinions of third-party speakers, presenters or participants.


Triple Top Trouble? NAS100 May Be Losing SteamThe NAS100 has formed a potential triple top, and key trendlines are starting to break to the downside. This could signal a short-term correction before bulls attempt another push for new highs. A temporary drop might offer a better long setup if momentum resets.

Macro enviornment effects on equities - Flat to Bearish The current macro-geopolitical environment presents several quantifiable bearish pressures on the Nasdaq. Housing markets are showing real signs of deterioration, with home listings in Florida and other regions down 15–20% from peak prices, and many individual properties seeing $100K+ price cuts—foreshadowing a broader 24–30% drawdown in real estate that could significantly erode consumer wealth and confidence. Labor market weakness is emerging beneath the surface, with rising layoffs in tech and new graduates facing difficulty securing jobs, even as the Fed is projected to cut rates twice by year-end. While disinflation supports policy easing, it is being outweighed by the drag from labor and housing stress. Geopolitically, the escalation risk in the Iran–Israel conflict introduces volatility and commodity price spikes, while the Ukraine war, though stagnating, remains unresolved. U.S. foreign policy appears increasingly erratic, adding further uncertainty premium. These elements combine to create a risk environment where upside in the Nasdaq is capped, and downside exposure remains
Flat to Bearish for the next 12 months, drawdown up to 25% to December 2021 high on NDX and support line during recent tariff crashes. long sustained drawdown would sustain for a while if we get into situations like housing collapse, or entering into a war, even indirectly like we did for Ukraine.
significant. NASDAQ:NDX NASDAQ:NDX NASDAQ:QQQ AMEX:SPY

USTECPrevious analysis on May 30 found that the price came down to test the support level at 20,693 but could not break through. Now the price has returned to test the resistance level at 21,737-22,139 again. If the price cannot break through the level of 22,139, it is expected that the price will drop. Consider selling in the red zone.
🔥Trading futures, forex, CFDs and stocks carries a risk of loss.
Please consider carefully whether such trading is suitable for you.
>>GooD Luck 😊
❤️ Like and subscribe to never miss a new idea!


US100Correlation Between US100 (Nasdaq 100), 10-Year Bond Yield, and Bond Prices
1. Relationship Between 10-Year Treasury Bond Yield and Bond Prices
Inverse Relationship:
Bond prices and yields move inversely. When the 10-year Treasury yield rises, bond prices fall, and vice versa. This is because the fixed coupon payments become less attractive when yields increase, causing existing bond prices to drop to offer comparable yields to new issues.
Current Data (June 13, 2025):
10-Year Treasury yield is around 4.40%, with the bond price near 98.81 (below par), reflecting recent yield increases.
Term Premium:
The term premium on the 10-year Treasury has risen sharply since early April 2025, reaching the highest level in over a decade. This premium compensates investors for risks that short-term yields may not evolve as expected, keeping long-term yields elevated and bond prices suppressed.
2. US100 (Nasdaq 100) and 10-Year Treasury Yield Correlation
Negative Correlation Generally Observed:
The Nasdaq 100 (US100), a tech-heavy equity index, often shows a negative correlation with 10-year Treasury yields. When yields rise, borrowing costs increase, discount rates for future earnings rise, and equities—especially growth stocks—tend to decline. Conversely, falling yields often boost equities.
Recent Trends:
In 2025, rising yields have put pressure on equities, including the Nasdaq 100, as investors demand higher returns from riskier assets. However, periods of yield stabilization or decline can support equity rallies.
Risk Sentiment:
The correlation can vary with market sentiment; during risk-off episodes, both equities and bond yields may fall as investors flock to safety.
3. US100 and Bond Prices
Indirect Relationship via Yields:
Since bond prices move inversely to yields, and yields often move inversely to equities, bond prices and equities like US100 often show a positive correlation in risk-off environments (both falling) and a negative correlation in risk-on environments (equities rising, bond prices falling).
Safe-Haven Demand:
In times of market stress, investors may sell equities and buy bonds, pushing bond prices up and yields down, while equities like US100 decline.
4. Yield Curve and Market Implications
The US yield curve has steepened recently, with the 10-year yield (~4.40%) above the 2-year yield (~3.95%), reflecting expectations of higher long-term inflation and growth risks.
A steepening curve can signal improving growth prospects but also higher financing costs, which can weigh on tech stocks in the US100.
Conclusion
The 10-year Treasury yield and bond prices move inversely, with recent yield increases pushing bond prices below par.
The Nasdaq 100 (US100) typically moves inversely to 10-year yields, as higher yields raise borrowing costs and discount rates, pressuring growth stocks.
The relationship between US100 and bond prices depends on market risk sentiment: in risk-off periods, bond prices rise while equities fall; in risk-on periods, the opposite occurs.
The current steepening yield curve and elevated term premium suggest ongoing volatility and cautious investor positioning affecting both bonds and equities.
#NAS100 #DOLLAR

NAS - TIME TO MAKE ACTIVE TRADER ROOM GREATER AGAIN!Team, last week we got a good entry on both DOW/US30 AND NAS100/TEC100
Yes, i do know about the situation with ISRAEL AND IRAN.
This will drag on for at least 3-6 months for the solutions
however, I expect the cease fire should be stop within next week as President Trump's is negotiation with Iran
There are two strategy to trade for the NAS- NASTY market
Rule: make sure you calculate how much position and volume you are taking risk on the trade. Every time you enter, ensure you are understood each trade risk.
As I always do.
The last 90 days we have not losing a single trade - check my new video release soon.
OK, lets get back to the trade set up again
entry small volume at market now.
If market falling down during US session, buy more at the second setting
However, I expect the 1st setting likely to recover soon.
Jump on board now.
See you to the moon


