NAS - SLOWLY enter the long positionTeam, NAS time to buy slowly
We been waiting for the last two day
as we expect market will drop before RATE announcement
this is a good entry but buy slowly
if it drop to second box, double up.. the volume
Trade with confident.
NAS100 trade ideas


Will NASDAQ Continue Its Climb? Here's my Trade Plan.📈 NASDAQ 100 (NAS100) Technical & Price Action Outlook 💡🚀
The NASDAQ has been in a strong bullish trend, driven by optimism around interest rates, tech earnings, and positive momentum. 📰💻 While price has pushed up aggressively, it’s now trading near key highs and buy-side liquidity zones—a spot where I’m anticipating a possible pullback. 🔁💰
I’m watching closely for a retracement into the 50% Fibonacci zone—my point of interest for a potential long setup. 🎯📐 However, I’ll only consider entering if price breaks structure bullish (BoS) after the pullback. 📊🧠
The index is still recovering from earlier 2025 losses, and resistance lies just ahead—so risk management is key. 🧘♂️⚠️
Not financial advice.


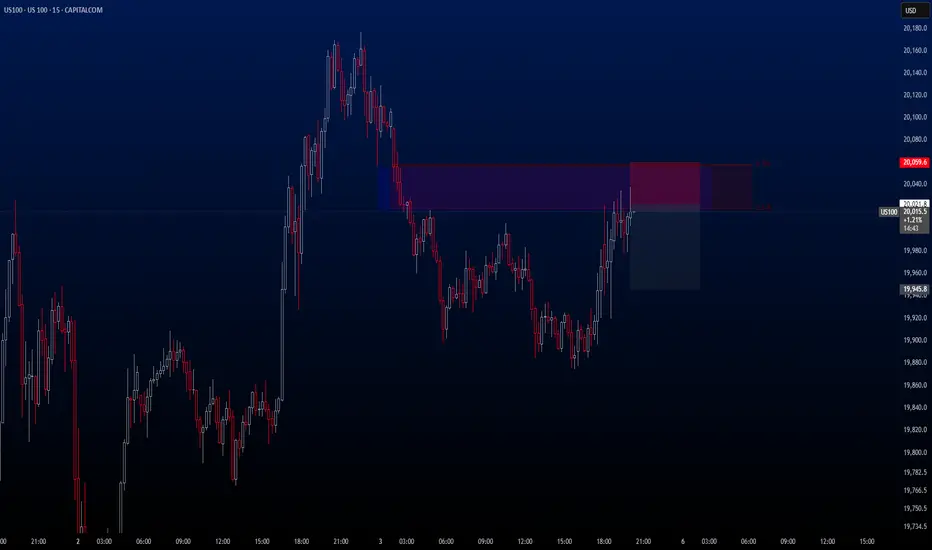
US100There’s a **Sell opportunity** forming on **US100**, but this one carries a bit more risk compared to the others.
That’s why I recommend opening the trade with a **smaller lot size** just for this setup.
🔍 **Criteria:**
✔️ Timeframe: 15M
✔️ Risk-to-Reward Ratio: 1:2
✔️ Trade Direction: Sell
✔️ Entry Price: 20021.8
✔️ Take Profit: 19945.8
✔️ Stop Loss: 20059.6
🔔 **Disclaimer:** This is not financial advice. It's a trade I’m taking based on my own system, shared purely for educational purposes.
📌 If you're also interested in systematic and data-driven trading strategies:
💡 Don’t forget to follow the page and subscribe to stay updated on future analyses.
Technical Breakdown on US100 | 1H TimeframeTechnical Breakdown on US100 (1H) using Volume Profile, Gann, and CVD + ADX
1. Key Observations (Volume, Gann & CVD + ADX Focused)
a) Volume Profile Insights:
Value Area High (VAH): 20,050
Value Area Low (VAL): 19,800
Point of Control (POC): 19,927.77
Volume Nodes:
High-volume node: Consolidation around 19,930–20,000 (strong interest/acceptance zone).
Low-volume gap: Below 19,800 (potential area for fast price movement).
b) Liquidity Zones:
Clustered Stops:
Above recent highs at ~20,100 (liquidity trap).
Below recent lows near 19,650 and 19,500.
Order Absorption Zones:
Near 19,930–19,980: multiple rejections + high delta volume = passive sell pressure.
c) Volume-Based Swing Highs/Lows:
Volume spike highs: 20,050 (indicating rejection and potential reversal).
Volume spike lows: 19,600–19,650 (reaction points with increased volume and defense).
d) CVD + ADX Indicator Analysis:
Trend Direction: Turning bearish.
ADX Strength:
ADX slightly above 20 with DI- crossing above DI+ = Confirmed downtrend.
CVD Confirmation:
Falling CVD alongside price weakness = Strong supply taking control.
Multiple failed bullish attempts above POC.
2. Support & Resistance Levels
a) Volume-Based Levels:
Support:
19,800 (VAL)
19,650 (swing low with high absorption)
Resistance:
20,050 (VAH and rejection zone)
19,927.77 (POC, now resistance)
b) Gann-Based Levels:
Swing High: 20,100 (Gann reversal point)
Swing Low: 19,650
Key Gann Retracements:
1/3 retracement = ~19,820
2/3 retracement = ~19,980
3. Chart Patterns & Market Structure
a) Trend: Bearish
b) Notable Patterns:
Bearish flag forming inside descending channel.
Break below POC and VAL suggests breakdown continuation.
Retest failure near POC confirms resistance validation.
4. Trade Setup & Risk Management
a) Bearish Entry (CVD + ADX confirm downtrend):
Entry Zone: 19,920–19,940 (retest of POC)
Target:
T1: 19,650
T2: 19,400
Stop-Loss (SL): 20,060 (above VAH and swing high)
Risk-Reward (RR): Minimum 1:2
b) Position Sizing:
Risk only 1–2% of trading capital per setup.

USNAS100 SHORT SETUPThe USNAS100 4-hour chart shows a bearish setup following a clear rejection at resistance. A rising wedge pattern has broken to the downside, indicating a shift in momentum. Technical indicators support the bearish bias, with price falling below trendline support and moving toward key support zones. The first target point is 19,250, where minor support exists. Continued selling pressure could push price further to the second target point at 18,400. The setup offers a favorable risk-to-reward ratio, with bearish signals aligning for a potential short trade opportunity. Risk management is advised above resistance.
Entry: 20,000
Target Points: 19,250 and 18,400

SHORT ON NAS100Nice Double Top on NAS at a major resistance level.
I will be selling nas to the next demand level for 2000-3000 points.

US100 WILL GO DOWN|SHORT|
✅US100 price grew again to retest the resistance of 20,300
But it is a strong key level
And we are already seeing
A local bearish pullback
So I think that there is a high chance
That we will see a bearish move down
SHORT🔥
✅Like and subscribe to never miss a new idea!✅
Disclosure: I am part of Trade Nation's Influencer program and receive a monthly fee for using their TradingView charts in my analysis.


The same repeat as 4 April 2022The market seems to be recovering and more and more positive ideas are emerging. However, on a weekly timeframe, the NDX appears to be forming a pattern very similar to what we saw at the end of 2021. Even the RSI shows remarkably similar levels.
Personally, I’m staying cautious. I haven’t taken a position yet, but I’m ready to buy in on the next significant dip. I’ve set my alert around 14,500 – let’s hope we reach that level again. 😉
What are your thoughts on this? Feel free to share your opinion!

X2: NQ/US100/NAS100 Long - Day Trades 1:2X2:
Risking 1% to make 2%
NAS100, US100, NQ, NASDAQ Long for day trade, with my back testing of this strategy, it hits multiple possible take profits, manage your position accordingly.
Risking 1% to make 2%
Use proper risk management
Looks like good trade.
Lets monitor.
Use proper risk management.
Disclaimer: only idea, not advice

