PIUSDT trade ideas

$PI Market Update📊 $PI/USDT Market Update
Welcome to today's analysis! Let’s break down the current price action on NASDAQ:PI and its potential trade setups.
🌐 Overview: NASDAQ:PI Approaching Key Support
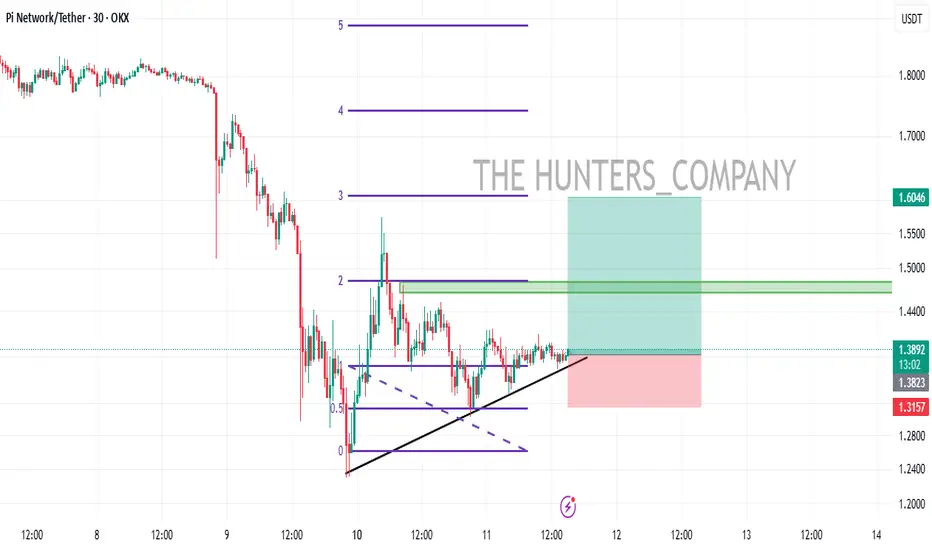
📉 NASDAQ:PI is approaching the green support zone, a key level where buyers might step in for a potential bounce.
🔄 Current Scenario:
If NASDAQ:PI holds the green zone, we could see a bounce from this level.
To cancel the bearish structure of lower highs (LH) and lower lows (LL), the price needs to break out of the blue zone.
🔑 Key Levels to Watch
🟢 Support Zone: Green Level (Potential bounce area)
🔵 Breakout Above Blue Zone: Could confirm the end of the bearish structure (LH and LL)
🛠️ Trade Scenarios
📌 Bullish Scenario (Bounce from Support & Breakout Above Blue Zone)
If NASDAQ:PI holds the green support, buyers could step in and push the price higher.
A breakout above the blue zone would confirm a trend shift, invalidating the bearish structure (LH & LL).
📌 Bearish Scenario (Break Below Support)
If NASDAQ:PI fails to hold the green zone, the price could continue its downtrend, leading to further declines.
📌 Conclusion
NASDAQ:PI is at a key decision point—holding the green support zone could lead to a bounce, but for a bullish reversal, the price must break out of the blue zone to cancel the bearish structure


PIUSDT Breakdown Incoming? Bearish Patterns Are Stacking Up! Yello, Paradisers! Is PIUSDT about to break down hard? The charts aren’t looking great, and the confluence of bearish signals is something we can’t ignore.
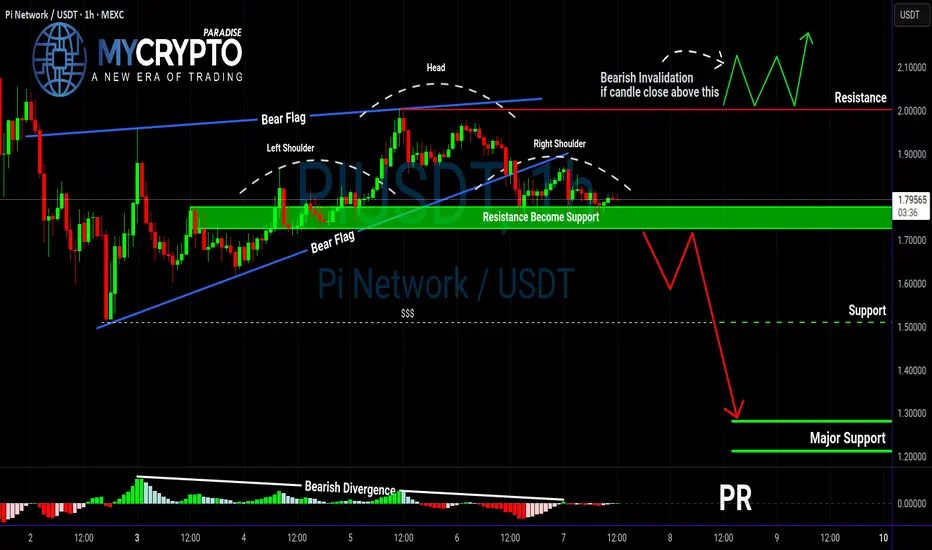
💎PIUSDT has formed a bear flag on the higher timeframe, a classic continuation pattern that suggests further downside. This alone is already a bearish signal, but there’s more.
💎On the lower timeframe, we can see a head & shoulders pattern forming, along with bearish divergence. These factors together significantly increase the probability of a move to the downside.
💎In the case of PIUSDT breakdown and closes candle below the support zone, this will confirm the bearish setup and likely trigger selling pressure. A breakdown at this level would validate both the bear flag and the head & shoulders pattern.
💎If the price bounces from here, the bearish bias still remains, but there’s also a chance that the market is setting a trap within this range. This makes it a high-risk zone, so it’s better to avoid trading here until a clearer move develops.
💎However, If the price breaks and closes candle above the resistance zone, the bearish outlook will be completely invalidated. In that case, it’s smarter to wait for a more defined price action before making any moves.
🎖Patience is key, Paradisers. The market loves to shake out inexperienced traders before the real move happens. Stay disciplined, focus on high-probability setups, and trade like a pro. Only those who truly understand market cycles will capitalize in the end!
MyCryptoParadise
iFeel the success 🌴
Bollinger Squeeze and resistance break to go longA squeeze on the Bollinger Bands could be happening in the coming days. This usually indicates consolidation, and an exit from such a pattern is generally explosive. You can see that it has already happened once on Pi.
So, a good squeeze on the BB followed by a breakout of the 'bounce zone' would be a strong long position, with a stop-loss (SL) around 1.6.
The previous analysis suggested a long position, but the price did not respond accordingly to the support, so I hope you didn’t enter a long position.
That's it for today. Have a good week, guys!

Pi Day is coming!🎉 Pi Day Is Coming Could It Drive a Rally?
Pi Day (March 14th, 2025) is just days away, and historically, it has brought major announcements, exchange speculation, and increased community activity.
With the mainnet launched, expectations are high could we see exchange listings, new features, or KYC updates? If the news is bullish, we might push towards 1.67762 or higher. But if there’s no major update, we could test support at 1.24012. Will newly unlocked coins be sold?
🔑 Key Levels to Watch
Resistance Levels:
• 1.67762 – First key level; a breakout could signal recovery.
• 1.919366 – Next target if momentum builds.
• 2.611833 – Major resistance and a psychological barrier.
Support Levels:
• 1.40761 – Current price; holding here is crucial.
• 1.50943 – Minor support below.
• 1.24012 – Stronger support if we dip further.
⸻
📈 Possible Scenarios for PI Price Action
🐂 Bullish Case (Pi Day Pump):
• Buyers step in at oversold levels, pushing price above 1.67762.
• Momentum builds towards 1.919366, with a strong rally targeting 2.611833.
• The RSI and Ichimoku Cloud setup supports a potential bounce.
🐻 Bearish Case (Further Dip):
• If Pi Day fails to bring impactful news, the price may retest 1.50943 or 1.24012.
• Bearish indicators (below MAs, weak trend) could continue weighing on PI.
⸻
#PiNetwork #PiDay2025 #CryptoNews #Trading #InvestSmart

PI USDT weakend update 30min/1h chartTechnical Analysis of PIUSDT
Timeframe: 30-minute chart (mid-short-term analysis).
Volatility:
There was a clear peak followed by a sharp decline, indicating increased volatility and likely liquidation of long positions after the peak.
Key Levels:
Support Levels:
± 1.77 – 1.78 USDT: Local support area where the price has recently consolidated.
± 1.74 USDT: Stronger support level, historically tested with rejection of lower prices.
Resistance Levels:
± 1.82 – 1.825 USDT: Immediate resistance, previously rejected at this level.
± 1.85 USDT: Next key resistance in case of an upward breakout.
Indicator Analysis:
1. Moving Averages (MAs):
The price is moving around the short MA (likely the 9 or 14 EMA), indicating consolidation after a decline.
The MA is currently acting as resistance above the price, suggesting weakness in the trend.
2. Volume:
After the sharp drop, volume has decreased, but a slight increase is visible during consolidation.
A clear volume surge during a breakout would confirm a stronger move.
3. MACD (bottom of the chart):
Bullish crossover: A positive signal indicating a potential upward correction.
The histogram bars are turning more positive, suggesting weakening bearish momentum.
Pattern Recognition:
Rejection at higher levels: Previous attempts to break above 1.82 USDT have been rejected, confirming this as a key resistance zone.
Range formation: The price is moving sideways between ±1.77 and 1.82 USDT. A breakout from this range will likely lead to a stronger trend move.
Potential Scenarios:
1. Bullish Scenario (upward breakout):
A breakout above 1.825 USDT with increased volume could lead to a test of 1.85 USDT, and potentially higher levels towards 1.88 – 1.90 USDT.
2. Bearish Scenario (downward breakdown):
A drop below 1.77 USDT could trigger further weakness towards the support area at 1.74 USDT.
If this level breaks, 1.70 USDT will be the next major target.
Strategy:
Wait for a clear breakout above 1.825 USDT or below 1.77 USDT before entering a position.
Bullish bias if the price breaks above the MAs with strong volume.
Bearish bias if 1.77 USDT is lost and selling volume increases.


PI/USDTTechnical Analysis of PI/USDT (MEXC Exchange)
1. Current Market Position
Price: 1.78493 USDT (-4.23% decline).
Volume: 9.0M (relatively high, indicating activity).
30-Day Average Volume: Unknown, but current movements suggest volatility.
2. Support and Resistance Levels
Resistance Levels:
Around 1.81691 - 1.91152 USDT (red zones).
Strongest resistance at 1.97694 USDT.
Support Levels:
First key support around 1.6903 - 1.75302 USDT.
Stronger support around 1.63479 - 1.6223 USDT.
Extremely strong support at 1.55585 USDT.
3. Expectation Based on Technical Structure
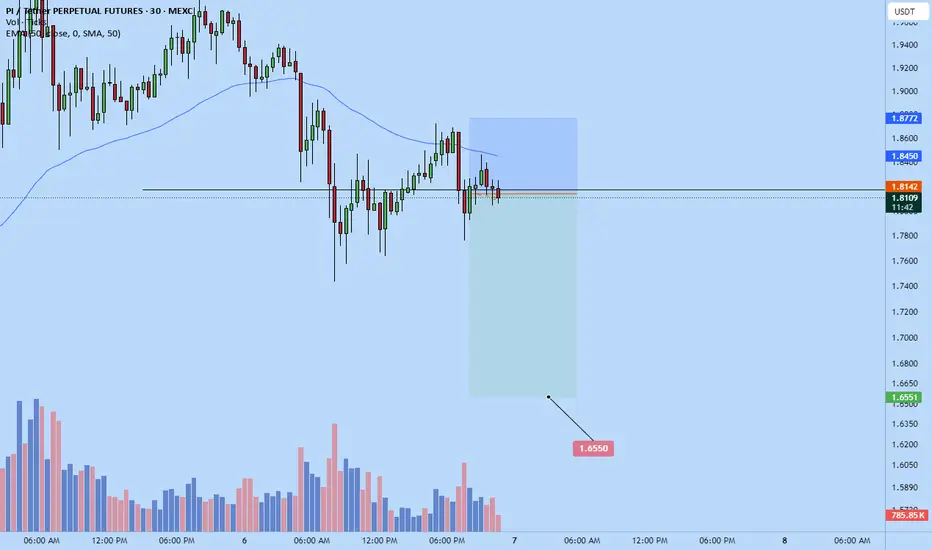
The blue projection line suggests a possible further decline towards the 1.63 USDT support zone, followed by a sideways movement.
A bullish reversal is expected afterward, which could lead to a rise toward 1.91 USDT.
The MACD indicator at the bottom shows a bearish trend but could soon form a bullish crossover if momentum shifts.
4. Conclusion & Strategy
Short-term: Further decline towards 1.63 USDT is possible before accumulation and an upward movement.
Long-term: If the 1.63 support holds, an upward move toward 1.91+ USDT could occur.
Trading Strategy:
Short if the price stays below 1.75 USDT and moves toward 1.63 USDT.
Buy the dip around the 1.63 USDT support zone with a stop-loss below 1.55 USDT.
Take profit at 1.81 - 1.91 USDT if the bounce occurs.
⚠️ Disclaimer: This is not financial advice. Always do your own research and apply risk management! 🚀

Pi short to $1.6550I anticipate pi will fall down to $1.6550.
First ever trade on his pair so lets see how it goes.
Pretty confident in the setup though. I don't think they have enough demand to drive the price up from here so I expect sellers to take full control for a while and drive it down to like $1.6550 area. That's where I have limit exit order as I'll be asleep and won't be able to monitor
PI/USDT : UPDATE...hello friends
Considering the good growth of this token, it has made a good ascending channel which is well supported by the bottom of the channel and it can be said that it is a valid channel...
Now we expect it to move to the specified goals.
Note that the indicated support is an important support for the price and must be maintained for further growth.
*Trade safely with us*

Potentially bear pennat pattern for PI
Potentially bear pennat pattern for PI
The analysis of the Pi highlights a critical moment The observed pattern, potentially a bear pennant, suggests a continuation of the current bearish trend. This formation typically follows a sharp price drop (flagpole) and is characterized by a brief consolidation phase within converging trendlines. If the price breaks below the lower trendline, it could signal further downside momentum.
This analysis reflects my opinions and is not financial advice.

TradeCityPro | PI: Detailed Crypto Analysis and Insights👋 Welcome to TradeCity Pro!
In this analysis, I want to review PI, which has been highly requested in the comments. This project was one of the oldest crypto airdrops, and its coin has finally been launched. Now, I want to analyze it for you.
✨ This coin doesn’t have much chart history, so I will analyze it using the 4-hour and 1-hour timeframes.
⏳ 4-Hour Timeframe
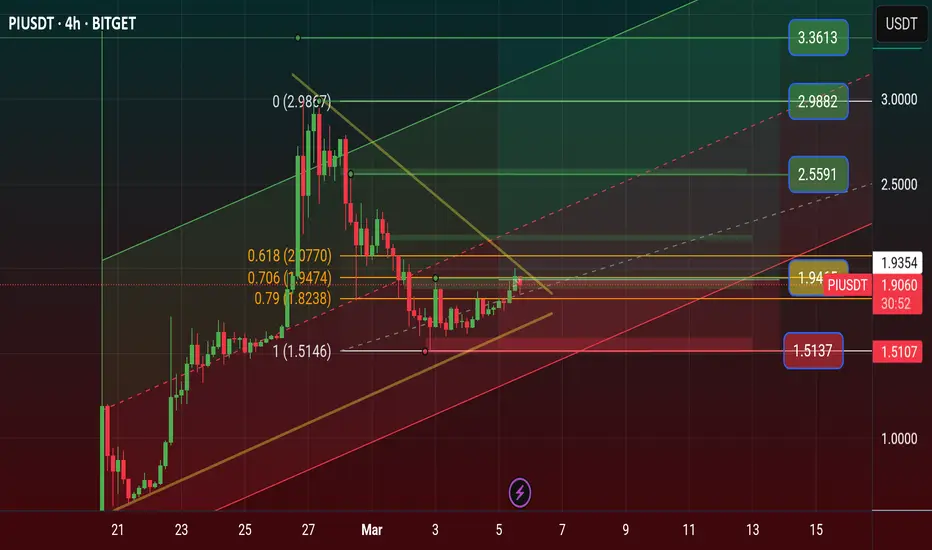
On the 4-hour timeframe, as you can see, after the launch of this coin, we saw a massive bullish leg, moving from $0.6498 to $2.9304. Currently, the price is undergoing a correction phase.
📊 Volume initially surged during the launch, which is expected, but it has been decreasing during the correction. RSI is also near the 56.08 trigger, and if this level is broken, strong momentum could enter the market.
🔼 The correction has continued to the 0.382 Fibonacci level, and it seems that a range has formed between the 0.382 and 0.236 Fibonacci retracement levels. If the top of this range is broken, we can enter a long position.
📉 If the correction continues, the next important levels are 0.5, 0.618, and 0.786 Fibonacci retracement levels, and we have to see which level the price reacts to.
⏳ 1-Hour Timeframe
On the 1-hour timeframe, we can see price movements in more detail.
🧲 As you can see, after the price hit the $1.6342 low, it has been forming a bullish structure and has now reached the $1.9807 level.
📈 If this level is broken, we can enter a long position. The next resistance level is $2.3479.
💥 The RSI oscillator is in a sensitive zone, and as long as it stays above the 50 level, market momentum remains bullish. However, if $1.8770 is broken, we can enter a short position.
📝 Final Thoughts
This analysis reflects our opinions and is not financial advice.
Share your thoughts in the comments, and don’t forget to share this analysis with your friends! ❤️

1/2/3**PI/USDT – 30-Minute Chart Analysis**
The price is moving within an ascending channel and has recently reached the **1.9730 - 2.0445** resistance zone. A rising wedge pattern has formed at the top of this trend, which could indicate weakening bullish momentum.
If the price reacts negatively to this level, a correction towards the **1.8500 - 1.8200** range is possible. Conversely, if the resistance is broken, the price could move towards **2.1000**.

$PiNASDAQ:PI is eating away at CRYPTOCAP:BTC & CRYPTOCAP:ETH … DYOR
ETF outflows on CRYPTOCAP:BTC are close to $300M..

PiNetwork ($PI) Analysis
#Pi Network is showing signs of consolidation near a key Fibonacci retracement level📊
➡️ Key Observations:
The price is currently hovering around the 1.05 support zone, a critical area for potential bullish reversal 📈
Fibonacci levels indicate possible retracement before continuation towards higher targets
Resistance zone around $2.40 - $2.60 aligns with the 0.618 Fibonacci level
⏳ Price Targets:
First target: $2.40
Second target: $3.00
Potential breakout: $3.60+
A strong bounce from support could confirm a bullish continuation towards these levels! 🚀

$PIUSDT Price Road to $11 Price Prediction 2025 Pi Network News: Can Pi Coin Price Hit $11? Key Levels Revealed, Pi Already Get place 11 of the Market.
Pi Network has gained 6.8% in the past 24 hours, outperforming major cryptocurrencies like Bitcoin (+7.5%), Ethereum (+8.9%), XRP (+11.1%), BNB (+9.8%), and Solana (+7.8%). But that’s not the real surprise.
Since its mainnet launch, PI's price has skyrocketed by an incredible 1,775.77%, while the overall crypto market has dropped by 11% in the same period. That’s a staggering contrast - and a sign that something big is happening.
With PI breaking key resistance levels and speculation about a major exchange listing growing, investors are wondering: How much higher can PI go? Could we see a breakout past $2? Let’s dive in.
💗 Why Is PI’s Price Rising?
Since February 20, PI has gained an incredible 1,775.75%, with a 7.5% jump in just the last 24 hours. This steady rise shows that Pi Network is moving independently of the broader market, maintaining strong momentum.
Key Reasons Behind PI’s Price Rally
Several factors are driving PI’s price increase:
Mainnet Migration Deadline Approaching
Pi Network is reaching its final deadline for users to migrate their holdings. According to a recent blog post from the team, March 17 is the last day to complete the migration. This deadline may be increasing buying pressure as investors prepare for the next phase.
🧡 Potential Binance Listing
Speculation around a Binance listing is another major factor. In a recent Binance community poll, over two-thirds of participants supported listing PI. If Binance or other major exchanges list it, the price could see a significant boost.
US Election Impact on Crypto
Donald Trump’s return to office is bringing a more crypto-friendly stance from the US government, which could benefit projects like Pi Network.
💝 Can PI Break $2.2?
Experts believe that if PI moves past the $2.2 resistance level with strong volume, it could rally toward $11. However, if it fails to break through, selling pressure could push it down to $1.5 Stoploss price area
To maintain its bullish trend, PI needs to hold support above $1.7. The price is currently just 1.11% below the key $2.2 level, making the next few days crucial in determining its next move.
🩷 Never Miss a Beat in the Crypto World!
Stay ahead with breaking news, expert analysis, and real-time updates on the latest trends in Bitcoin, altcoins, DeFi, NFTs, and more.
Pi Network has defied market trends and harsh criticism before, and if history is any guide, this rally might just be getting started.
🩵 Why Is Pi Coin’s Price Rising?
Pi Coin’s price is rising due to increasing exchange interest, migration deadlines, and strong community support, pushing demand higher.
💜 Nano History Will Pi Coin Reach $11?
If Pi breaks the $2 resistance with strong volume, experts predict a rally toward $11. Failure could lead to a drop below $1.5
💛 Is Binance Listing Pi Coin?
Binance has not officially listed Pi yet, but a recent community poll shows strong support, increasing the chances of a future listing.
PI Coin - Price Surge and Market PositionAs of March 5, 2025, Pi Coin has experienced significant developments:
Price Surge and Market Position
Pi Coin's price has risen by approximately 6.8% over the past 24 hours, reaching $1.84. This increase has elevated its market capitalization to around $12.51 billion, making it the 11th largest cryptocurrency by market cap.
Increased Trading Volume
The 24-hour trading volume for Pi Coin has surged to approximately $772 million, indicating heightened trading activity and investor interest.
Upcoming Binance Listing Speculations
There is speculation that Pi Coin may be listed on Binance around March 14, coinciding with the deadline for users to complete Know Your Customer (KYC) verifications on the Pi Network. This potential listing is anticipated to further boost Pi Coin's visibility and liquidity.
Technical Indicators
Technical analysis suggests that Pi Coin has formed a bullish divergence and a falling wedge pattern, both of which are typically considered positive indicators for potential price appreciation.
Disclaimer: Please note that cryptocurrency markets are highly volatile, and prices can change rapidly. It's essential to conduct thorough research and consider your risk tolerance before making any investment decisions.

(THIS IS NOT FINANCIAL ADVICE!)(THIS IS NOT FINANCIAL ADVICE!)
I think we are about to break out of consolidation/accumulation zone and make a new ATH in short-term, but I personally prefer to HODL long-term. NASDAQ:PI data in CMC is finally fixed and it makes Pi Coin 11th by market cap globally. My prediction is that NASDAQ:PI will be at 17$ by the end of 2025.
I've been in this project since 2019, I was actively mining Pi Coins and since 2023 working as identity validator. I recommend checking out this project, there was misunderstanding with Pi Network being scam, but I remember when in 2020-2021 more and more scammers/fraudsters showed up, the real Pi Core Team are not associated with scamming people, they are very smart, patient and they are focusing on their goal.
But before you start trading Pi Coin here is what you need to know about it:
What is Pi Network?
Pi Network is a social cryptocurrency, developer platform, and ecosystem designed for widespread accessibility and real-world utility. It enables users to mine and transact Pi using a mobile-friendly interface while supporting applications built within its blockchain ecosystem.
Who Are the Founders of Pi Network?
Pi Network was founded by Dr. Nicolas Kokkalis and Dr. Chengdiao Fan, both of whom have PhDs from Stanford University and a passion for improving human lives through technology. Dr. Nicolas Kokkalis is a Stanford PhD in EE and postdoc in CS with research on distributed systems and human-computer interaction. His work focuses on combining distributed systems and human computer interaction to bring cryptocurrency to everyday people. As a strong and long-term believer of the technical, financial and social potential of cryptocurrencies, he is determined to move them beyond their current limitations and is committed to bringing the power of blockchain to more people. Dr. Chengdiao Fan holds a Stanford PhD in Anthropological Sciences, harnessing social computing to unlock human potential on a global scale. Chengdiao is building Pi Network to mobilize individuals all over the world to participate and be rewarded for their contributions, and establish an inclusive ecosystem for global citizens to unleash and capture their own agency, and in turn create utilities and productions for society and the world.
Supply Model and Mining Mechanism:
Pi Network follows a negative exponential declining token issuance model, where mining rates decrease over time based on time and network growth and participation.
Ecosystem and Adoption:
Pi Network has built an integrated ecosystem that facilitates real-world transactions and decentralized applications. Pi can be used as a medium of exchange for goods and services, including online commerce and local brick-and-mortar businesses. Users can engage with Core Team and community-built apps in the Pi ecosystem through the Pi Browser, where integrated features like the Pi Wallet provide a seamless experience. Events like PiFest 2024 showcased Pi’s growing adoption, with over 27,000 active sellers and 28,000 test merchants across 160 countries.
Compliance and Identity Verification
Pi Network follows a one-account-per-person policy through its Know Your Customer (KYC) solution. This system combines machine automation and human verification to authenticate user identities while preserving privacy. The KYC process emphasizes real individuals, combats fraudulent activities and enables fair participation in the mining process of the network. Pi’s identity verification approach balances scalability, security, and accessibility, allowing millions of users worldwide to validate their accounts while maintaining regulatory compliance.

