Candlestick Reversals vs. IndicatorsA simple question to think about. Do indicators make charts too confusing, have mixed success, and ultimately fall victim to whipsaw with an occasional big winner?
Would it be better to use an indicator free daily chart and just observe the buyer and seller psychology that candlesticks offer?
Can
Sorry, this is only available to registered users
SHFE provides data to our registered users only, so to get it you'll need to sign up for a TradingView account.
No news here
Looks like there's nothing to report right now

Morningstar Candlestick Pattern Forming at the monthly PivotThis 3 candle pattern is a good indicator that a bullish reversal is underway. Price was driven lower on day 1. On day 2 price was initially driven lower but buyers stepped in to take control. And they took control at the monthly pivot which adds even more significance to the move. Finally, on day


Elliott Wave: Copper (HG) Impulsive Rally Signals More UpsideCopper ( NYSE:HG ) has been displaying a strong bullish trend, with the rally from the July 11, 2022 low unfolding in a Elliott Wave diagonal. This rally is structured as a 5-swing pattern, which is characteristic of a motive wave. This suggests that the broader trend favors further upside. As of th

Daily HG analysisDaily HG analysis
A long position with the target and stop loss as shown in the chart
The trend is up, we may see more upside
All the best, I hope for your participation in the analysis, and for any inquiries, please send in the comments.
He gave a signal from the strongest areas of entry, special


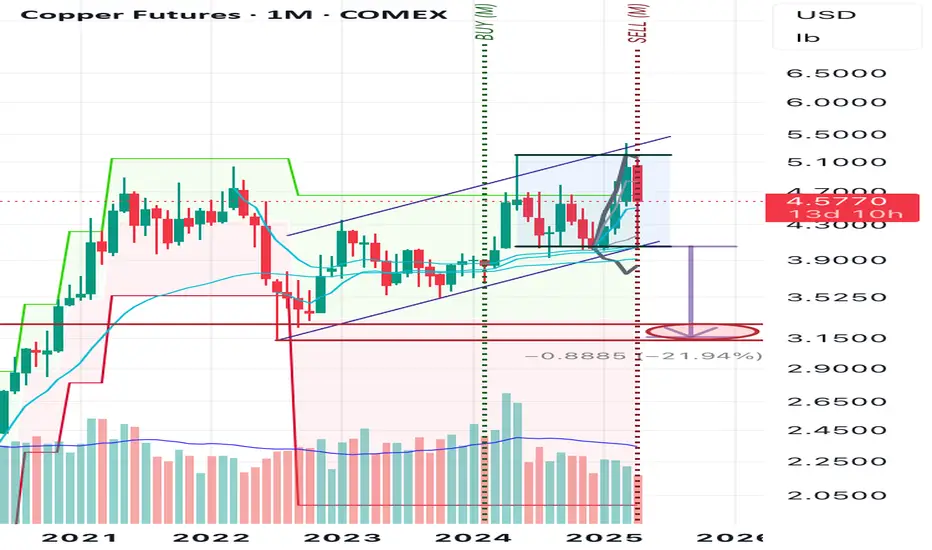
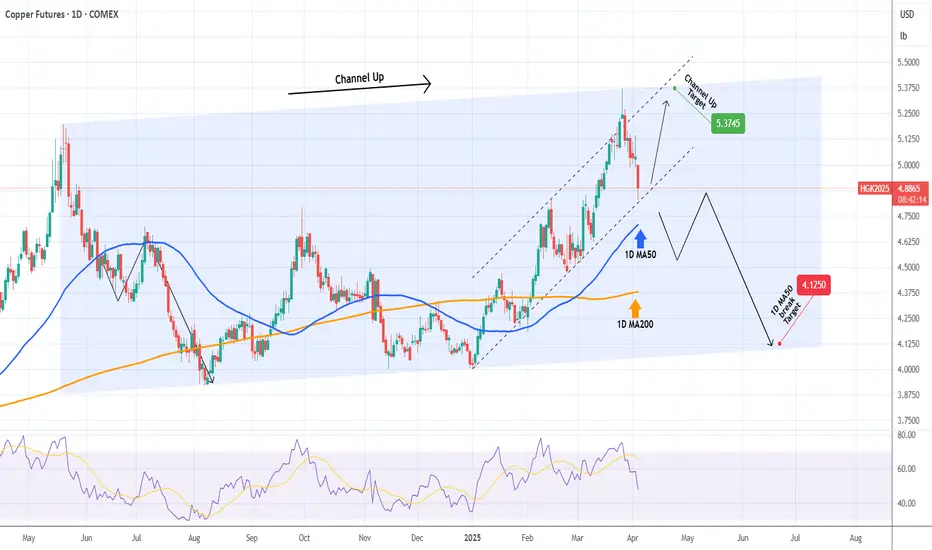
COPPER The 1D MA50 is the key.Last time we looked at Copper (HG1!) was on January 24 (see chart below) giving a buy signal that easily hit our 4.6550 Target:
This time the market is in front of a critical moment. The 2025 pattern has been a Channel Up, which last Wednesday reached the top (Higher Highs trend-line) of the 1-
Copper is red hot right now. Here’s whyCopper’s COMEX price hit a new high on 26th March making the red metal red hot right now. The first three months of 2025 have seen industrial metals make noticeable gains with the Bloomberg Industrial Metals Subindex up 10.55% year to date1. Copper’s gains, however, stand out for numerous reasons.

See all ideas
Summarizing what the indicators are suggesting.
Neutral
SellBuy
Strong sellStrong buy
Strong sellSellNeutralBuyStrong buy
Neutral
SellBuy
Strong sellStrong buy
Strong sellSellNeutralBuyStrong buy
Neutral
SellBuy
Strong sellStrong buy
Strong sellSellNeutralBuyStrong buy
A representation of what an asset is worth today and what the market thinks it will be worth in the future.
Sorry, this is only available to registered users
SHFE provides data to our registered users only, so to get it you'll need to sign up for a TradingView account.
Displays a symbol's price movements over previous years to identify recurring trends.
CUK2025
May 2025R
Can't show you this
CUM2025
Jun 2025R
Can't show you this
CUN2025
Jul 2025R
Can't show you this
CUQ2025
Aug 2025R
Can't show you this
CUU2025
Sep 2025R
Can't show you this
CUV2025
Oct 2025R
Can't show you this
CUX2025
Nov 2025R
Can't show you this
CUZ2025
Dec 2025R
Can't show you this
CUF2026
Jan 2026R
Can't show you this
CUG2026
Feb 2026R
Can't show you this
CUH2026
Mar 2026R
Can't show you this
See all CU1! contracts
Frequently Asked Questions
Open interest is the number of contracts held by traders in active positions — they're not closed or expired. For Copper Cathode Futures this number is 168.55 K. You can use it to track a prevailing market trend and adjust your own strategy: declining open interest for Copper Cathode Futures shows that traders are closing their positions, which means a weakening trend.
Buying or selling futures contracts depends on many factors: season, underlying commodity, your own trading strategy. So mostly it's up to you, but if you look for some certain calculations to take into account, you can study technical analysis for Copper Cathode Futures. Today its technical rating is buy, but remember that market conditions change all the time, so it's always crucial to do your own research. See more of Copper Cathode Futures technicals for a more comprehensive analysis.