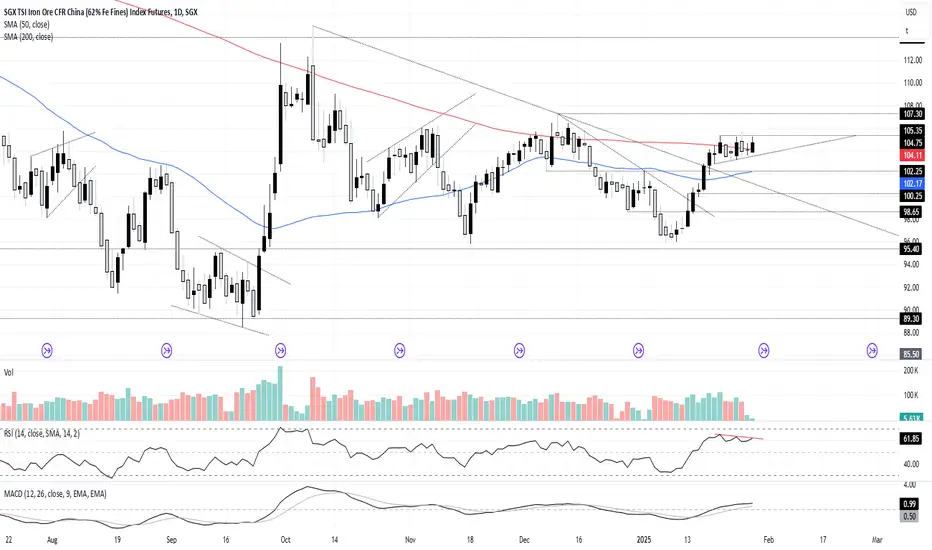
IO Weekly Technicals Review [2025/07]: IO Losing Upward SteamSGX TSI Iron Ore CFR China (62% Fe Fines) Index Futures (“SGX IO Futures”) dipped last week, closing USD 1.05/ton lower by 14/Feb (Fri).
SGX IO Futures opened at USD 106.05/ton on 10/Feb (Mon) and closed at USD 105.0/ton on 14/Feb (Fri).
Prices briefly touched a weekly high of USD 108.80/ton on 14/Feb (Fri) and a low of USD 104.20/ton on 14/Feb (Fri). It traded in a range of USD 4.60/ton during the week, which was narrower than the prior week.
Prices traded between the pivot point of USD 105.05/ton and R1 point of USD 108.05/ton throughout the week, closing below the pivot point of USD 105.05/ton.
Volume peaked on 14/Feb (Fri) as Cyclone Zelia disrupted mining operations, spiking iron ore prices amid uncertainty.
Iron Ore Fundamentals in Summary
China’s record-high new credit in January signals mixed trends. Early fiscal support and a rise in long-term corporate loans hint at recovering business demand. It is unclear if this growth is sustainable or temporary with banks front loading loans ahead of Lunar New Year.
Mortgage loans fell after three months of gains, raising concerns about slowing home sales.
Western Australia’s iron ore hub was hit by Category 5 Cyclone Zelia, the strongest since 2007 halting major mines and ports like Port Hedland. Strong winds and heavy rains disrupted operations impacting mining giants BHP, Rio Tinto, and Fortescue. Dampier and Varanus Island ports reopened on Friday after inspections of navigation aids, channels and berths. The port authority confirmed resumption of safe operations.
China's port IO stockpiles rose by 0.05 million tons (+0.03%) WoW to 149.96 million tons for the week ending 14/Feb per MMI data.
Based on seasonality, SGX IO Futures Mar contract trades 17.9% below its last 5-year average (USD 129.33/ton).
IO Prices Plunging Below Short-Term Moving Averages Signal Bearishness
Formation of a golden cross on 17/ Jan (Fri) triggered a rally in iron ore with prices rising 5.2% over three weeks before losing steam on Friday. Prices plunged sharply below both the 9-day (USD 106.07/ton) & 21-day (USD 105.22/ton) moving averages on 14/Feb (Fri).
Will IO Prices Revert to its Long-Term Averages?
IO prices are trading above 100-day & 200-day DMAs. Prices show signs of reversion towards the longer-term moving averages following corrections on Friday. Will IO prices tend towards the longer-term average?
MACD Signals Bearish Trend Emergence, RSI Cross Portends Bears Ahead
The MACD indicator converged with the signal line this week indicating weakening of bullish trend. Meanwhile, the RSI is at 59.98, at neutral levels as it hovers above the midpoint, with its RSI-based moving average at 52.13. RSI MA forming a death-cross portends bearishness ahead.
Volatility Rose & Prices Closed Below 50% Fibonacci Level Fueling Bearishness
Volatility inched higher late in the week. Prices traded between the 61.8% Fibonacci level (USD 107.62/ton) and the 50% level (USD 105.36/ton), closing below the 50.0% Fibonacci level. Going forward, 50 Fibonacci level (USD 105.36/ton) may act as resistance, with 38.2% Fibonacci level (USD 103.1/ton) as support.
Buying Pressure Softened & IO Prices Trade Below Bollinger Band Basis Levels
Buying pressure softened during second half of last week based on A/D indicator. Having tested the ceiling of the Bollinger band, IO prices witnessed sharp correction to close below the Bollinger Band basis price level of USD 105.30/ton.
IO Prices Rose Towards CNY & Spiked Even Higher Due to Cyclone Zelia
Iron ore prices typically rise in the period leading up to the Chinese New Year due to increased demand, followed by a sharp decline post-holiday as industrial activity slows. This pattern is consistent across multiple years but in 2025, iron ore prices followed the usual trend of rising before the Chinese New Year but remained stable afterward, unlike previous years' sharp post-holiday declines.
Source: SGX
IO Futures Only Aggregate Exposure
Financial Institutions (FIs) and Managed Money participants are net long with 115.4k lots and 35.7k across all futures expiries. Physicals participants and Others are net short with 116.9k and 34.2k lots respectively across all futures expires. Managed Money switched from net short to net long positions, Physicals increased net short positions while FIs decreased net long positions last week. Overall futures open interest was 984,935 lots as of 07/Feb (-16.5%) while it was 1,179,418 lots as of 31/Jan.
Source: SGX
IO Futures & Options Aggregate Exposure
Financial Institutions (FIs) and Managed Money participants are net long with 116.3k lots and 44.8k across all futures and options expiries. Physicals participants and Others are net short with 122.1k and 39.0k lots respectively across all futures and options expires. Managed Money switched from net short to net long positions, Physicals increased net short positions while FIs decreased net long positions last week. Overall futures and options open interest was 1,234,295 lots as of 07/Feb(-13.2%) while it was 1,421,263 lots as of 31/Jan.
Source: SGX
Historical Futures Aggregate Exposure by Market Participants
Physical participants have switched from net long to net short over the last three weeks. Managed Money participants have switched from net short to being net long. Financial Institutions continue to hold net long positions since the second quarter of last year.
Source: SGX
Hypothetical Trade Setup
Western Australia’s was hit by Cyclone Zelia halting major mines and ports. Strong winds and rains disrupted operations. Prices rallied. But on Friday, port authority confirmed resumption of safe operations. Temporary tail winds supporting IO has now faded.
IO prices plunged sharply below short-term both moving averages on Fri and risks inching towards longer term moving averages. The MACD indicator indicates weakening bullishness. while RSI MA cross formed a death-cross portending bearishness ahead. IO prices closed below 50% Fibonacci levels signaling weakness.
Against this backdrop, this paper posits a short position in SGX Iron Ore Futures expiring 28th March 2025 (FEFH2025) with an entry at USD 105.30 combined with a take profit level at USD 100.80 and a stop-loss at USD 108 resulting in a reward-to-risk ratio of 1.67x.
DISCLAIMER
This case study is for educational purposes only and does not constitute investment recommendations or advice. Nor are they used to promote any specific products, or services.
Trading or investment ideas cited here are for illustration only, as an integral part of a case study to demonstrate the fundamental concepts in risk management or trading under the market scenarios being discussed. Please read the FULL DISCLAIMER the link to which is provided in our profile description.
RBZ2017 trade ideas

IO Weekly Technicals Review [2025/06]: Correction Looms SGX TSI Iron Ore CFR China (62% Fe Fines) Index Futures (“SGX IO Futures”) rose last week, closing USD 2.25/ton higher by 07/Feb (Fri).
SGX IO Futures opened at USD 105.05/ton on 03/Feb (Mon) and closed at USD 107.30/ton on 07/Feb (Fri).
Prices briefly touched a weekly high of USD 107.50/ton on 07/Feb (Fri) and a low of USD 102.00/ton on 03/Feb (Mon). It traded in a range of USD 5.50/ton during the week, which was wider than the prior week.
Prices traded between the pivot point of USD 105.35 and S1 point of 103.85 throughout the week, crossing the R1 point of USD 107.20/ton on Fri and closing above it.
Volume peaked on 07/Jan (Fri) with volume increasing significantly compared to the previous week levels.
Iron Ore Fundamentals in Summary
Dalian iron ore futures reached a four-month high, posting strong weekly gains. The recovery was driven by steel mills resuming production, increased activity in the property sector, and rising Chinese equities after the Lunar New Year.
China filed a WTO complaint against new U.S. tariffs and urged dialogue. While trade tensions remain a concern, steel-related commodities continued to rise, with steelmaking ingredients and Shanghai Futures Exchange benchmarks posting strong gains.
Iron ore futures rebounded as a softer U.S. dollar (-0.4%) made commodities more affordable for global buyers. Additionally, Rio Tinto cleared ships from Western Australian ports due to cyclone threats, adding a risk premium to prices.
China's port IO stockpiles rose by 4.63 million tons (+3.19%) WoW to 149.91 million tons for the week ending 07/Feb per MMI data.
Based on seasonality, SGX IO Futures Mar contract trades 17.3% below its last 5-year average (USD 125.16/ton).
Short-Term Moving Averages Signal Bullish Trend, But Correction Looms
Formation of a golden cross on 17/ Jan (Fri) followed by upward trend for three weeks indicating that the bullishness may sustain in the near term. Prices are trading above both the short-term moving averages.
Long-Term Averages Indicate Convergence of Moving Averages
IO prices crossed and closed significantly above the 200-day DMA. Signaling a strengthening bullish trend as prices beats the 200-day DMA, with a probability of convergence between long-term moving averages.
MACD Signals Bullish Momentum; RSI Inching Towards Overbought Zone
The MACD signals a positive momentum starting from 14/Jan with growing bullishness observed last week. Meanwhile, the RSI is at 65.08, is inching towards the overbought zone and it hovers above the midpoint, with its RSI-based moving average at 60.97.
Volatility Rose, Price Closed Above 50% Fibonacci Level
Volatility gained upward momentum late in the week. Prices traded between the 38.2% Fibonacci level (USD 103.10/ton) and the 61.8% level (USD 107.62/ton), closing below the 61.8% Fibonacci level. Going forward, 61.8% Fibonacci level (USD 107.62/ton) may act as resistance, with 50.0% Fibonacci level (USD 105.36/ton) as support.
Buying Pressure Intensified, Price Trading Near the Upper-Bollinger Bands
Buying pressure has intensified in the later part of the week according to the Accumulation/Distribution (A/D) indicator. The price is trading between the upper-volume node and basis-volume node, closing the week near the upper-volume node.
IO Prices Rise Towards CNY & Then Decline Thereafter
Between 2021 & 2024, SGX IO futures prices have risen leading up to the Chinese New Year before tapering off ten trading days after the holiday. Prices declined before & after CNY holidays only in 2024 while prices continued to rise even after CNY before falling sharply in 2021 & 2022.
A similar trend was observed in the ten-day period leading up to CNY 2025.
IO Futures Only Aggregate Exposure
Financial Institutions (FIs) are net long with 136.6k lots across all futures expiries. Managed Money participants, Physicals participants and Others are net short with 15.5k, 103.5k and 17.3k lots respectively across all futures expires. Managed Money decreased net short positions, Physicals increased net short positions while FIs decreased net long positions last week. Overall futures open interest was 1,179,418 lots as of 31/Jan stood at lots (-3.5%) while it was 1,222,981 lots as of 24/Jan.
Source: SGX
IO Futures & Options Aggregate Exposure
Financial Institutions (FIs) are net long with 133.2k lots across all futures & options expiries. Managed Money participants, Physicals participants and Others are net short with 7.0k, 106.9k and 19.2k lots respectively across all futures and options expires. Managed Money decreased net short positions, Physicals increased net short positions while FIs decreased net long positions last week. Overall futures and options open interest was 1,421,263 as of 31/Jan stood at lots (-5.2%) while it was 1,499,318 lots as of 24/Jan.
Source: SGX
Historical Futures Aggregate Exposure by Market Participants
Physical participants have switched from net long to net short over the last three weeks. Managed Money participants have maintained net short positions for the past month. Financial Institutions continue to hold net long positions since the second quarter of this year.
Source: SGX
Hypothetical Trade Setup
Prices are currently trading above short-term moving averages and significantly above both long-term moving averages, hovering near the upper Bollinger Band, which suggests potential resistance at these levels. Historical trends indicate a pattern of price declines in the last three days of the 10-day period following the Chinese Lunar New Year, a movement that could potentially repeat this year. While managed money participants have reduced their short positions over the past two weeks, signaling a more optimistic outlook, we take a contrarian view and recommend a short position strategy this week, anticipating a potential price correction from current levels.
The hypothetical trade setup involves entering a short position at USD 107.6/ton with a take profit level at USD 104.3/ton combined with a stop loss at USD 109.0/ton resulting in a 2.35x reward-to-risk ratio.
DISCLAIMER
This case study is for educational purposes only and does not constitute investment recommendations or advice. Nor are they used to promote any specific products, or services.
Trading or investment ideas cited here are for illustration only, as an integral part of a case study to demonstrate the fundamental concepts in risk management or trading under the market scenarios being discussed. Please read the FULL DISCLAIMER the link to which is provided in our profile description.

Is SGX Iron Ore Poised for Another Leg Higher?After rallying from the January 7 swing low, iron ore has spent the past week consolidating, forming what looks like a bullish pennant.
While price action above the 200-day moving average has been shaky over the past year, traders should watch for a potential topside break in thin Lunar New Year conditions. A break and close above $105.35 could open the door to $107.30, the December 10 swing high. Clearing that may put $108 in focus, with a move beyond strengthening the case for a run towards $114 resistance.
RSI (14) has diverged slightly from price, but the bearish signal is offset by the continued uptrend in MACD.
Good luck!
DS
IO Weekly Technicals Review [2025/04]: Bullish Trend Pre-CNYSGX TSI Iron Ore CFR China (62% Fe Fines) Index Futures (“SGX IO Futures”) rose last week, closing USD 1.05/ton higher by 24/Jan (Fri).
SGX IO Futures opened at USD 103.70/ton on 20/Jan (Mon) and closed at USD 104.75/ton on 24/Jan (Fri).
Prices briefly touched a weekly high of USD 105.35/ton on 21/Jan (Tue) and a low of USD 102.85/ton on 20/Jan (Mon). It traded in a range of USD 2.50/ton during the week, which was narrower than the prior week.
Prices traded between the pivot point of USD 101.85 and R1 point of 106.35 throughout the week.
Volume peaked on 21/Jan (Tue), as prices traded within the range in the week leading up to Chinese New Year.
Iron Ore Fundamentals in Summary
Dalian iron ore futures saw early gains on China’s stimulus and easing Sino-U.S. tensions but fluctuated midweek on U.S. tariff threats, closing slightly higher as falling port inventories and a weaker dollar provided support.
Mixed steel prices reflected short-term boosts from rising hot metal output and policy support, offset by lingering property sector woes, trade uncertainties, and structural market challenges.
Port Hedland reopened after a cyclone, easing supply concerns, while Fortescue and ASX:BHP reported stable iron ore output despite operational challenges, contributing to steady market sentiment.
China's port IO stockpiles dropped by 1.35 million tons (-0.92%) WoW to 145.28 million tons for the week ending 24/Jan per MMI data .
With implied volatility at multi-year lows, the market signals limited expectations for significant price moves after a strong 2025 showing.
Based on seasonality, SGX IO Futures Jan contract trades 18.6% below its last 5-year average (USD 128.93/ton).
Short-Term Moving Averages Indicate Strengthening of Bullish Trend
Formation of a golden cross on 17/Jan (Fri) followed by upward trend this week indicate that the bullishness may sustain in the near term.
Prices hit a significant high the previous week before consolidating at elevated levels.
Long-Term Averages Signals Possible Consolidation Near 200-day MA
IO prices consolidated near the 200-day MA and closed slightly above the 200-day MA. This indicates the strengthening of the bullish trend as prices near the 200-day MA, with prices may consolidate at this level or show signs of a correction next week.
MACD Signals Bullish Momentum; RSI Inching Towards Overbought Zone
The MACD signals a positive momentum starting from 14/Jan. Meanwhile, the RSI is at 64.67 inching towards the overbought zone and hovering above the midpoint. Its RSI-based moving average is at 54.02.
Volatility Steady, Price Closed Above 38.2% Fibonacci Level
Volatility remained steady throughout the week. Prices traded between the resistance levels of 38.2% Fibonacci level (USD 103.15/ton) and the 50.0% Fibonacci level (USD 105.40/ton) during the week. Going forward, the 50.0% Fibonacci level at USD 105.40/ton will act as resistance while the 38.2% level at USD 103.15/ton will act as the support.
Buying Pressure Intensified, Price Trading Near the High-Volume Nodes
Buying pressure has grown stronger from the start of this week according to the Accumulation/Distribution (A/D) indicator. The price is trading near the high-volume node. Price closed the week near the Upper Bollinger Band.
IO Prices Rise Towards CNY & Then Decline Thereafter
Between 2021 & 2024, SGX IO futures prices have risen leading up to the Chinese New Year before tapering off ten trading days after the holiday. Prices declined before & after CNY holidays only in 2024 while prices continued to rise even after CNY before falling sharply in 2021 & 2022.
A similar trend is observed in the first seven days of the ten-day period leading up to CNY 2025.
IO Futures Only Aggregate Exposure
Financial Institutions (FIIs) are net long with 157.1k lots across all futures expiries. Managed Money participants, Physicals participants and Others are net short with 134.7k, 5.1k and 17.2k lots respectively across all futures expires.
Managed Money decreased net short positions last week, while FIIs decreased net long positions. Overall futures open interest as of 17/Jan stood at 1,213,572 lots (9.6%), while it was 1,107,236 lots as of 10/Jan.
Source: SGX
IO Futures & Options Aggregate Exposure
Financial Institutions (FIIs) are net long with 152.9k lots across all futures & options expiries. Managed Money participants, Physicals participants and Others are net short with 129.1k, 5.1k and 18.6k lots respectively across all futures and options expires.
Managed Money decreased net short positions last week, while FIIs decreased net long positions. Overall futures and options open interest as of 17/Jan stood at 1,484,889 lots (8.2%), while it was 1,372,286 lots as of 10/Jan.
Source: SGX
Historical Futures Aggregate Exposure by Market Participants
Physical participants have switched from net long to net short over the last week. Managed Money transitioned from net long to net short positions over the last month, signaling a notable shift in market sentiment. Financial Institutions continue to hold net long positions since the second quarter of this year.
Source: SGX
Hypothetical Trade Setup
Optimism around China's improving narrative in the lead-up to CNY has bolstered sentiment. Iron ore prices have climbed sharply, buoyed by a brighter outlook on recent stimulus measures.
Technical indicators present mixed signals, with bullish signs such as a golden cross formation in short-term moving averages and prices trading near the upper Bollinger Band, alongside consolidation signals like RSI inching towards the overbought zone and prices nearing long-term moving averages. Amid this backdrop, a Bullish Call Spread enables portfolio managers and traders to participate in potential further upside while limiting the downside risk of a price pullback.
A bullish call spread involves buying a lower strike call option (105 Call paying a premium of USD 3.48/ton) and selling a higher strike call option (108 Call collecting a premium of USD 2.32/ton). The position provides a maximum profit of USD 284/lot, a maximum loss of USD 116/lot delivering a 2.45x reward-to-risk ratio with a breakeven at USD 106.16/ton. These calculations are based on SGX IO option premiums as of close of markets on 24th January 2025.
DISCLAIMER
This case study is for educational purposes only and does not constitute investment recommendations or advice. Nor are they used to promote any specific products, or services.
Trading or investment ideas cited here are for illustration only, as an integral part of a case study to demonstrate the fundamental concepts in risk management or trading under the market scenarios being discussed. Please read the FULL DISCLAIMER the link to which is provided in our profile description.

IO Weekly Technicals Review [2025/03]: Uptrend to PersistSGX TSI Iron Ore CFR China (62% Fe Fines) Index Futures (“SGX IO Futures”) rose last week, closing USD 6.75/ton higher by 17/Jan (Fri).
SGX IO Futures opened at USD 97.40/ton on 13/Jan (Mon) and closed at USD 104.15/ton on 17/Jan (Fri).
Prices briefly touched a weekly high of USD 104.20/ton on 17/Jan (Fri) and a low of USD 97.40/ton on 13/Jan (Mon). It traded in a range of USD 6.80/ton during the week, which was wider than the prior week.
Prices opened near the pivot point of USD 97.50 and closed above the R4 point of USD 104.05 at the end of the week.
Volume peaked on 17/Jan (Fri), as prices hit new highs due to China’s stronger-than-expected economic recovery.
Iron Ore Fundamentals in Summary
IO prices began the week on an uptrend as IO prices rose in early Asian trade, driven by strong Chinese trade data, robust iron ore imports, and optimism around China's stimulus measures and fiscal strength.
Despite the week's rally, economists caution that the rise is sentiment-driven rather than fundamental. Falling Chinese steel demand and potential U.S. tariffs on Chinese goods could continue to weigh on raw material prices.
IO prices rose throughout the week as China’s GDP (Q4) edged up 5.0% YoY and Industrial production (Dec) increased by 6.2% YoY.
China's port IO stockpiles grew by 0.3 million tons (0.2%) WoW to 146.63 million tons for the week ending 17/Jan, according to MMI data .
Along with rising port inventories, the Housing prices (Dec) dropped by 5.3% YoY. With implied vols at multi-year lows, expectations for significant near-term movement remain limited after a strong second week of 2025.
Based on seasonality, SGX IO Futures Feb contract trades 19.4% below its last 5-year average (USD 128.93/ton).
Short-Term Moving Averages Shows Bullish Trend Amid Golden Cross Formation
The formation of a golden cross on 17/ Jan (Fri) indicates that the bullish trend may be sustained in the near term. Prices gained upward momentum early this week and continued to rise throughout the week.
Long-Term Averages Signals Possible Consolidation near 200-day MA
IO prices crossed the 100-day MA and closed slightly below the 200-day MA. This indicates the strengthening of the bullish trend as prices near the 200-day MA, with prices consolidating at this level next week.
MACD signals Bullish Momentum but Potential for Consolidation Emerging
The MACD signals a positive momentum starting from 14/Jan. Meanwhile, the RSI is at 63.46, in the overbought zone, and hovers way above the midpoint, with its RSI-based moving average at 45.13.
Volatility Declined; Price Closed Above 38.2% Fibonacci Level
Volatility rose through the week but dipped by the end. Prices broke the resistance levels of 23.6% Fibonacci level (USD 100.35/ton) and the 38.2% Fibonacci level (USD 103.20/ton) during the week. Going forward, the 50.0% Fibonacci level at USD 105.45/ton will act as resistance while the 38.2% level at USD 100.35/ton will act as the support.
Buying Pressure Intensified, Prices Near Mid of High & Low Volume Nodes
Buying pressure has grown stronger from the start of this week according to the Accumulation/Distribution (A/D) indicator. The price is trading near the mid of high & low-volume nodes. Price closed the week near the Upper Bollinger Band.
IO Prices Rise Towards CNY & Then Decline Thereafter
Between 2021 & 2024, SGX IO futures prices have risen leading up to the Chinese New Year before tapering off ten trading days after the holiday. Prices declined before & after the CNY holidays only in 2024 while prices continued to rise even after CNY before falling sharply in 2021 & 2022.
A similar trend is observed in the first three days of the ten days leading up to CNY 2025.
IO Futures Only Aggregate Exposure
Financial Institutions (FIIs) and Physicals participants are net long with 159.5k and 20.3k lots across all futures expiries. Managed Money participants and Others are net short with 166.9k and 12.8k lots respectively across all futures expires. Managed money increased net short positions last week, while FIIs increased their net long positions. Physicals switched from being Net Short to Net Long over the week as of 10th Jan 2025 relative to the previous week. Overall futures open interest as of 10/ Jan stood at 1,107,236 lots (4.1%) while it was 1,063,467 lots as of 03/Jan.
Source: SGX
IO Futures & Options Aggregate Exposure
Financial Institutions (FIIs) and Physicals participants are net long with 154.1k and 24.8k lots across all futures & options expiries. Managed Money participants and Others are net short with 170.9k and 8.1k lots respectively across all futures & options expires. Managed money increased net short positions last week, while FIIs increased their net long positions. Physicals switched from being Net Short to Net Long over the week as of 10th Jan 2025 relative to the previous week. Overall futures & options open interest as of 10/ Jan stood at 1,372,286 lots (+4.4%) while it was 1,314,185 lots as of 03/Jan.
Source: SGX
Historical Futures Aggregate Exposure by Market Participants
Physical participants have switched from net short to net long over the last week. Managed Money transitioned from net long to net short positions in the last three weeks, signaling a notable shift in market sentiment. Financial Institutions continue to hold net long positions since the second quarter of this year.
Source: SGX
Hypothetical Trade Setup
Optimism around China's improving narrative ahead of the Chinese New Year has bolstered sentiment. Iron ore prices have climbed sharply, buoyed by a brighter outlook on recent stimulus measures. As trend-followers drive momentum, medium to longer-term fundamentals will likely take a backseat in the short term. Technical indicators present mixed signals, with bullish signs such as a golden cross formation in short-term moving averages and prices trading near the upper Bollinger Band, alongside consolidation signals like RSI slightly above neutral and prices nearing long-term moving averages.
Against this bullish momentum backdrop, this hypothetical trade setup involves entering a long position at USD 103.5/ton with a take profit level at USD 108.00/ton combined with a stop loss at 100.8/ton resulting in a 1.67x reward-to-risk ratio.
DISCLAIMER
This case study is for educational purposes only and does not constitute investment recommendations or advice. Nor are they used to promote any specific products, or services.
Trading or investment ideas cited here are for illustration only, as an integral part of a case study to demonstrate the fundamental concepts in risk management or trading under the market scenarios being discussed. Please read the FULL DISCLAIMER the link to which is provided in our profile description.

Iron Ore: Momentum Builds, 200DMA in SightIron ore futures have seen a decent rally over the past fortnight, rebounding from below $100 a tonne on strong volumes to take out downtrend resistance dating back to early December before going on with the move.
The price is now testing a zone that includes minor horizontal resistance at $102.25 and downtrend established in October when Chinese markets were rollicking along in peak stimulus mode. With momentum indicators firmly with the bulls, traders should be alert for a potential extension of the rally.
If we see the price push above this zone, longs could be established with a stop beneath for protection. The 200-day moving average looms as a potential target with $107.30 the next after that.
Take note of how poorly the price has traded above the 200-day moving average over recent months. As such, if the price action falters around this level again, those seeking the higher target may want to reconsider the merits of the trade.
Good luck!
DS

IO Weekly Technicals Review [2025/02]: Bearish Sentiment SoftensSGX TSI Iron Ore CFR China (62% Fe Fines) Index Futures (“SGX IO Futures”) rose last week, closing USD 0.4/ton higher by 10/Jan (Fri).
SGX IO Futures opened at USD 98.45/ton on 06/Jan (Mon) and closed at USD 98.85/ton on 10/Jan (Fri).
Prices briefly touched a weekly high of USD 99.45/ton on 10/Jan (Fri) and a low of USD 95.9/ton on 07/Jan (Tue). During the week, they traded in a range of USD 3.55/ton, which was narrower than the prior week.
Prices were near the S1 point of USD 96.65/ton throughout the week and closed between the pivot point of USD 99.45/ton and the S1 point of USD 96.65/ton.
Volume peaked on 06/Jan (Mon), as prices were weighed down by slow production of hot metal in China.
Iron Ore Fundamentals in Summary
IO prices pulled back at the start of last week as declining production at Chinese steel mills coincided with rising imports, increasing portside inventories. Production is expected to remain subdued as many mills undergo maintenance ahead of the Chinese New Year.
Nonetheless, IO prices ended the week of 10/Jan moderately higher, supported by China's expanded stimulus measures. Extension of consumer goods trade-in scheme to boost demand has sparked optimism about future iron ore demand.
IO prices remained muted mid-week as China's CPI edged up just 0.1% YoY and stayed flat MoM, highlighting deflationary pressures. China's port IO stockpiles grew by 1.1 million tons (0.8%) WoW to 146.33 million tons for the week ending 10/Jan, according to MMi data .
Rising port inventories and continued RMB depreciation are weighing down on IO prices. With IVs at multi-year lows, market signals limited expectations for significant near-term movement.
Based on seasonality, SGX IO Futures Feb contract trades 24.6% below its last 5-year average (USD 128.93/ton).
Short-Term Moving Averages Indicate Bearish Trend Amid Modest Rebound
Following the formation of a death cross on 20/Dec (Fri), the gap between the 9-day and 21-day moving averages widened over the subsequent weeks, highlighting bearish momentum in the market. Prices gained upward momentum late this week.
Long-Term Averages Signal Strengthening of a Bearish Trend
IO price was below the 100-d SMA throughout the week, closing below it as well. This indicates the strengthening of the bearish trend as prices fell below both the long-term moving averages despite a modest rise.
MACD Signals Weakening Bearishness and Potential Reversal, RSI at Neutral Level
The MACD signals an upward reversal starting from 9/Jan. Meanwhile, the RSI is at 44.80, suggesting a positive momentum and it hovers above the midpoint, with its RSI-based moving average at 39.51.
Volatility Near Multi-Year Low, Price Closed Below 23.6% Fibonacci Level
Volatility remained stagnant. Prices hovered between the 23.6% Fibonacci level at USD 100.25/ton and the 0% Fibonacci level throughout the week. Going forward, the 23.6% Fibonacci level will act as resistance while the 0% level at USD 95.8/ton will act as the support.
Selling Pressure Intensified, Price Still Trading at Low Volume Nodes
Selling pressure continues to dominate and grew stronger by the end of the week according to the Accumulation/Distribution (A/D) indicator. The price is trading at a relatively low-volume node. Price closed the week near the midpoint of the Bollinger Band.
IO Price Sways Wildly Before and After Chinese New Year Break
IO prices have generally risen in the lead-up to Chinese New Year, largely due to stockpiling activity by Chinese steel mills ahead of the holiday season. However, post-CNY performance is more varied, potentially influenced by factors like post-holiday demand and inventory levels.
IO Prices Rise Towards CNY & Then Decline Thereafter
Between 2021 and 2024, SGX IO futures prices have risen leading up to the Chinese New Year before tapering off ten trading days after the holiday. Only in 2024 did the price decline before & after CNY holidays. In 2021 & 2022, prices continued to rise even after CNY before falling sharply.
IO Prices Rise Towards CNY & Then Decline Thereafter (2)
Over the last four years, IO futures prices have gained nearly 3% in the ten trading days leading up to CNY. In the 10 days after, IO prices rise another 4.4% over the next 5 trading days before shedding 5% over the next 5 trading days. Interestingly, price moves have been mostly within 1x standard deviation.
IO Futures Only Aggregate Exposure
Financial Institutions (FIIs) are net long with 143.4k lots across all futures and options expiries. Managed Money, Physical market participants, and Others are net short with 106.8k, 20.6k and 16.0k lots respectively across all futures expiries. Managed money increased net short positions last week, while physicals decreased net short positions. Overall futures & options open interest as of 03/ Jan stood at 1,063,467 lots (-19.5% WoW) while it was 1,321,215 lots as of 27/Dec.
Source: SGX
IO Futures & Options Only Aggregate Exposure
Financial Institutions (FIIs) are net long with 137.7k lots across all futures and options expiries. Managed Money, Physical market participants, and Others are net short with 105.9k, 19.2k, and 12.5k lots respectively across all futures and option expiries. Managed money increased net short positions last week, while physicals decreased net short positions. Overall futures & options open interest as of 03/ Jan stood at 1,314,185 lots (-19% WoW) while it was 1,622,836 lots as of 27/Dec.
Source: SGX
Historical Futures Aggregate Exposure by Market Participants
Physical participants have switched from net long to net short over the last quarter. Managed Money transitioned from net long to net short positions in the last two weeks, signaling a notable shift in market sentiment. Financial Institutions continue to hold net long positions since the second quarter of this year.
Source: SGX
Hypothetical Trade Setup
IO prices faced pressure from rising imports, a weakened yuan, & weaker domestic steel demand. However, China's stimulus measures & the consumer trade-in scheme aimed at boosting consumption provide support, showing positive signs for recovery. Additionally, technical indicators signal weakening bearishness and a potential reversal. A bullish call spread is a tactical alternative to express this view.
While IVs are at multi-year lows, upcoming macro data from China could drive it higher. This includes the PBoC loan prime rate, housing prices, fixed asset investment, and industrial production. However, the risk of disappointing economic figures from China remains a concern.
Investors might adopt a cautious bullish stance through a bullish call spread using SGX IO Options. This involves buying a lower-strike call and selling a higher-strike call, providing capped upside and downside at a lower cost than a mere long call. A hypothetical bullish call spread, with a long call at USD 99/ton and a short call at USD 101/ton expiring on 28/Feb, offers a 2x reward-to-risk ratio. The position provides a maximum profit of USD 134/lot, a maximum loss of USD 66/lot, and a breakeven at USD 99.66/ton.
DISCLAIMER
This case study is for educational purposes only and does not constitute investment recommendations or advice. Nor are they used to promote any specific products, or services.
Trading or investment ideas cited here are for illustration only, as an integral part of a case study to demonstrate the fundamental concepts in risk management or trading under the market scenarios being discussed. Please read the FULL DISCLAIMER the link to which is provided in our profile description.

IO Weekly Technicals Review [2025/01]: IO Poised for RecoverySGX TSI Iron Ore CFR China (62% Fe Fines) Index Futures (“SGX IO Futures”) fell last week, closing USD 0.35/ton lower by 03/Jan (Fri).
SGX IO Futures opened at USD 99.1/ton on 30/Dec (Mon) and closed at USD 98.75/ton on 03/Jan (Fri).
Prices briefly touched a weekly high of USD 102.25/ton on 01/Jan (Wed) and a low of USD 97.9/ton on 03/Jan (Fri). It traded in a range of USD 4.35/ton during the week, which was wider than the prior week.
Prices tested the weekly R1 point of USD 101.1/ton throughout the week and closed between the pivot point of USD 99.85 and the S1 point of USD 97.65/ton.
Volume spiked on 03/Jan (Fri), as iron ore prices reached their lowest level since 19/Nov.
Iron Ore Fundamentals in Summary
Iron ore prices declined for the week ending 03/Jan, amid signs of rising inventories and weakening demand in China.
Disappointing economic data from China further weighed on demand outlooks. China’s manufacturing PMI declined to 50.1 in December, down from 50.3 in November, and missed analyst expectations of 50.3.
The daily average port pick-up volume of imported ore decreased by 47k tons WoW to 3.08 million tons.
China's port iron ore stockpiles grew by 240k tons (0.2%) WoW to 145.22 million tons in the week ending 03/Jan, according to SMM data .
Based on seasonality, SGX IO Futures Jan contract trades 23.8% below its last 5-year average (USD 128.93/ton).
Short-Term Moving Averages Indicate Strengthening Bearish Trend
Following the formation of a death cross on 20/ Dec (Fri), the gap between the 9-day and 21-day moving averages widened over the subsequent week, highlighting bearish momentum in the market. Further declines are possible if support levels are breached.
Long-Term Averages Signal Persistent Bearish Trend
IO prices tested the 100-d SMA throughout the week, closing below the 100-d SMA by the end of the week. This indicates the strengthening of the bearish trend as prices fell below both the long-term moving averages.
MACD Points to Deepening Bearish Momentum, RSI at Neutral level
The MACD indicates a stronger bearish sentiment starting from 18/Dec and persisting through the current week. Meanwhile, the RSI is at 39.33, suggesting a neutral stance and it hovers slightly below the midpoint, with its RSI-based moving average at 42.39.
Volatility Spiked; Price Closed Below 23.6% Fibonacci Level
Volatility spiked on 03/Jan (Fri) to end the week higher. Prices hovered over the 23.6% Fibonacci level at USD 100.59/ton throughout the week but declined sharply to close below the 23.6% Fibonacci level. Going forward, the 23.6% Fibonacci level will act as resistance while the 0% level at USD 96.09/ton will act as the support.
Selling Pressure Strengthened, Price Closed at Low Volume Nodes
According to the Accumulation/Distribution (A/D) indicator, selling pressure continued to dominate and grew stronger by the end of the week. The price closed the week at a relatively low-volume node and along the lower Bollinger Band.
IO Futures Only Aggregate Exposure
Financial Institutions (FIIs) are net long with 136.2k lots across all futures expiries. Managed Money, Physical market participants and Others are net short with 26.4k, 79.2k and 30.6k lots respectively across all futures expires. Overall futures open interest as of 03/ Jan stood at 1,321,215 lots.
Source: SGX
IO Futures & Options Only Aggregate Exposure
Financial Institutions (FIIs) are net long with 130.6k lots across all futures and options expiries. Managed Money, Physical market participants and Others are net short with 19.6k, 82.1k and 28.9k lots respectively across all futures and option expires. Overall futures & options open interest as of 03/ Jan stood at 1,622,836 lots.
Source: SGX
Historical Futures Aggregate Exposure by Market Participants
Physical participants have switched from net long to net short over the last quarter. Managed Money transitioned from net short to net long positions, despite ending December with a reported net short, signaling a notable shift in market sentiment. Financial Institutions continue to hold net long positions since the second quarter of this year.
Source: SGX
Hypothetical Trade Setup
Iron ore prices face downward pressure due to increasing inventories and subdued demand, primarily driven by weakness in China's steel industry. Technical indicators signal continued bearishness, with prices failing to breach resistance levels and trading below short and long-term moving averages. However, before the Chinese New Year, seasonal stockpiling by steel mills after 01/Jan is expected to provide some support to spot prices.
A long futures position carries downside risk if next week’s CPI and PPI data disappoint. Alternatively, investors can express a bullish view through a bullish call spread using SGX IO options. This involves buying a lower-strike call and selling a higher-strike call, providing capped upside and downside at a lower premium cost than a long call. A hypothetical bullish call spread, with a long call at USD 100/ton and a short call at USD 102/ton expiring on 28/Feb, offers a 1.86x reward-to-risk ratio. The position provides a maximum profit of USD 130/lot, a maximum loss of USD 70/lot, and a breakeven at USD 100.7/ton.
DISCLAIMER
This case study is for educational purposes only and does not constitute investment recommendations or advice. Nor are they used to promote any specific products, or services.
Trading or investment ideas cited here are for illustration only, as an integral part of a case study to demonstrate the fundamental concepts in risk management or trading under the market scenarios being discussed. Please read the FULL DISCLAIMER the link to which is provided in our profile description.

IO Weekly Technicals Review [2024/52]: Downtrend to PersistSGX TSI Iron Ore CFR China (62% Fe Fines) Index Futures (“SGX IO Futures”) fell last week, closing USD 1.45/ton lower by 27/Dec (Fri).
SGX IO Futures opened at USD 100.3/ton on 23/Dec (Mon) and closed at USD 98.85/ton on 27/Dec (Fri).
Prices briefly touched a weekly high of USD 102.1/ton on 23/Dec (Mon) and a low of USD 98.65/ton on 27/Dec (Fri). It traded in a range of USD 3.45/ton during the week, which was narrower than the prior week.
Prices were under the pivot point of USD 102.25/ton at the start of the week and closed slightly above the S1 point of USD 97.65/ton.
Volume peaked on 27/Dec (Fri) as IO price touched its weekly low.
Iron Ore Fundamentals in Summary
Iron ore prices posted a weekly decline on 27/Dec (Fri) despite reports of China’s record plan to issue USD 411 billion in treasury bonds in 2025 to stimulate its economy. The news failed to boost market sentiment.
Steel mills in China showed limited interest in winter stockpiling. Given the current profit margins, their focus remains on negotiating lower prices.
China's port iron ore stockpiles fell by 860k tons (0.59% WoW) to 144.99 million tons in the week ending 27/Dec, according to MMI data .
Based on seasonality, SGX IO Futures Jan contract trades 21.6% below its last 5-year average (USD 126.03/ton).
Short-Term Moving Averages Indicate Strengthening Bearish Trend
Following the formation of a death cross on 20/ Dec (Fri), the gap between the 9-day and 21-day moving averages widened last week, signalling a strengthening & continued bearish trend.
Long-Term Averages Signal Potential Beginning of a Bearish Trend
IO prices tested the 100-d SMA throughout the week but fell, closing below the 100-d SMA by the end of the week. This indicates the beginning of a bearish trend as prices fell below both the long-term moving averages.
MACD Points to Deepening Bearish Momentum, RSI at Neutral Level
The MACD indicates a stronger bearish sentiment starting from 18/Dec and persisting through the current week. Meanwhile, the RSI is at 41.78, suggesting a neutral stance and it hovers slightly below the midpoint, with its RSI-based moving average at 46.93.
Volatility Inched Down, Price Closed Below 23.6% Fibonacci Level
Volatility declined moderately last week. Prices hovered over the 23.6% Fibonacci level at USD 100.35/ton throughout the week but declined sharply to close below the 23.6% Fibonacci level.
Going forward, expect the 23.6% Fibonacci level to act as resistance while the 0% level at USD 95.8/ton will act as support.
Selling Pressure Intensified, Price Trading at Low Volume Nodes
Selling pressure continues to dominate and has grown stronger by the end of the current according to the Accumulation/Distribution (A/D) indicator. The price is trading at a relatively low-volume node. Price also closed the week along the lower Bollinger Band.
IO Futures Only Aggregate Exposure
Financial Institutions (FIIs) and Managed money are net long with 130.4k and 8.4k lots across all futures expiries. Physical market participants and Others are net short with 99.3k and 39.4k lots across all futures expires. Overall futures & options open interest as of 27/ Dec stood at 1,311,576 lots.
Source: SGX
IO Futures & Options Aggregate Exposure
Financial Institutions (FIIs) and Managed money are net long with 126.1k and 17.3k lots across all futures expiries. Physical market participants and Others are net short with 105k and 38.4k lots across all futures expires. Overall futures & options open interest as of 27th Dec 2024 stood at 1,617,924 lots.
Source: SGX
Historical Futures Aggregate Exposure by Market Participants
As of 27th Dec 2024, physical participants have switched from net long to net short over the last quarter. Managed Money has shifted from net short to net long. Financial Institutions continue to hold net long positions since the second quarter of this year.
Source: SGX
Hypothetical Trade Setup
The seasonal demand uptrend seems unlikely, with Chinese steel mills showing limited stockpiling activity. Iron ore prices lack near-term catalysts, while technical indicators highlight a strengthening bearish trend as prices stay below both short-term and long-term moving averages. These technical and fundamental factors suggest prices have yet to bottom out.
To convey a bearish outlook with controlled risk, investors could consider an SGX iron ore put spread. This involves purchasing a USD 98/ton put and selling a USD 96/ton put, both expiring on 31/Jan. The strategy offers a reward-to-risk ratio of 1.7x, with a maximum potential profit of USD 127 and a maximum potential loss of USD 73 per 100-ton lot (excluding transaction costs).
DISCLAIMER
This case study is for educational purposes only and does not constitute investment recommendations or advice. Nor are they used to promote any specific products, or services.
Trading or investment ideas cited here are for illustration only, as an integral part of a case study to demonstrate the fundamental concepts in risk management or trading under the market scenarios being discussed. Please read the FULL DISCLAIMER the link to which is provided in our profile description.

IO Weekly Technicals Review [2024/51]: Bearish Trend StrengthensSGX TSI Iron Ore CFR China (62% Fe Fines) Index Futures (“SGX IO Futures”) fell last week, closing USD 3.82/ton lower by 20/Dec (Fri).
SGX IO Futures opened at USD 104.45/ton on 16/Dec (Mon) and closed at USD 100.63/ton on 20/Dec (Fri).
Prices briefly touched a weekly high of USD 105.80/ton on 17/Dec (Tue) and a low of USD 99.80/ton on 20/Dec (Fri). It traded in a range of USD 6/ton during the week, which was wider than the prior week.
Prices tested the pivot point of USD 104.60/ton at the start of the week and closed below the S1 point of USD 101.85/ton.
Volume peaked on 19/Dec (Thu), as iron ore prices declined by 0.9%, as the PBoC kept its loan prime rates unchanged.
Iron Ore Fundamentals in Summary
Iron ore prices declined for the week ending 20/Dec, following the PBoC's decision to keep loan prime rates unchanged on 19/Dec.
Earlier optimism over China’s 2025 monetary policy easing plans faded after the rate pause dampened market sentiment.
Australia’s Department of Industry, Science and Resources said in a quarterly outlook that iron ore prices will average USD 80/ton in 2025 and then drop to USD 76/ton in 2026.
With the US dollar touching a two-year high, Iron Ore prices are turning bearish with markets awaiting China’s next move to support its economy.
China's port iron ore stockpiles inched up 0.01% to 145.85 million tons in the week ending 20/Dec, according to MMI data .
Based on seasonality, SGX IO Futures Jan contract traded 18.8% below its last 5-year average (USD 123.99/ton).
Short-Term Moving Averages Indicate Reversal in Bullish Trend
The 9-day moving average crossed the 21-day moving average from above, culminating in a death cross on 20/Dec (Fri). This signals the potential onset of a bearish trend.
Long-Term Averages Signal Potential Beginning of a Bearish Trend
IO prices tested the 200-d SMA at the start of the week but sharply fell, closing below the 100-d SMA by the end of the week. This indicates the beginning of a bearish trend as prices fell below both the long-term moving averages.
MACD Points to Growing Bearishness, RSI Inches Towards Oversold Territory
The MACD indicates a growing bearish sentiment starting from 18/Dec. Meanwhile, the RSI is at 40.60 and is inching towards oversold territory treading below the midpoint, while the RSI-based moving average is at 51.90.
Volatility Inched Down, Price Closed Below 23.6% Fibonacci Level
Volatility declined moderately last week. Prices tested the 50% Fibonacci level at USD 105.4/ton at the start of the week but quickly declined in the week to close below the 23.6% Fibonacci level at USD 100.35/ton. Going forward, the 23.6% Fibonacci level will act as resistance while the 38.2% level at USD 103.15/ton will act as the support.
Selling Pressure Intensified, Price Trading at Low Volume Nodes
Selling pressure continues to dominate and has grown stronger since the start of December, according to the Accumulation/Distribution (A/D) indicator. The price is trading at a relatively low-volume node. Price also closed the week below the lower Bollinger Band.
Iron Ore Prices Likely to Fall in December Despite Seasonality
Iron ore prices generally increase in December due to seasonal patterns that prompt restocking in anticipation of China's Lunar New Year, driven by higher demand for steel production. However, it looks like in December 2024, prices will likely decline.
IO Futures Only Aggregate Exposure
Financial Institutions (FIs) and Managed money are net long with 124.7k and 26.6k lots across all futures expiries. Physical market participants and Others are net short with 110.1k and 41.2k lots across all futures expiries. Overall futures open interest as of 13th Dec 2024 stood at 1,259,936 lots.
Source: SGX
IO Futures & Options Aggregate Exposure
Financial Institutions (FIs) and Managed money are net long with 121.5k and 37.1k lots across all futures & options expiries. Physical market participants and Others are net short with 117.6k and 41k lots across all futures & options expiries. Overall futures & options open interest as of 13th Dec 2024 stood at 1,565,080 lots.
Source: SGX
Historical Futures Aggregate Exposure by Market Participants
Physical participants have switched from net long to net short over the last quarter. Managed Money has shifted from net short to net long. Financial Institutions continue to hold net long positions since the second quarter of this year.
Source: SGX
Hypothetical Trade Setup
Despite expectations of seasonally strong demand ahead of the Lunar New Year, market sentiment for SGX Iron Ore remains bearish. China's sluggish economic recovery suggests a rebound may hinge on monetary policy easing in 2025. Additionally, technical indicators reinforce the bearish outlook, with prices falling below both short- and long-term moving averages. A short position on SGX Iron Ore could be a strategic way to express this view.
We propose a hypothetical trade setup involving selling the SGX Iron Ore January Futures Contract at USD 102/ton, with a stop loss at USD 105/ton and a target price of USD 97/ton, yielding a reward-to-risk ratio of 1.67x. Each contract provides exposure to 100 tons of iron ore, resulting in a potential gain of USD 500/lot ((102 - 97) x 100) against a risk of USD 300/lot. This calculation excludes transaction costs, such as clearing broker and exchange fees. The SGX requires a minimum initial margin of USD 1,188/lot and a maintenance margin of USD 1,080/lot.
DISCLAIMER
This case study is for educational purposes only and does not constitute investment recommendations or advice. Nor are they used to promote any specific products, or services.
Trading or investment ideas cited here are for illustration only, as an integral part of a case study to demonstrate the fundamental concepts in risk management or trading under the market scenarios being discussed. Please read the FULL DISCLAIMER the link to which is provided in our profile description.

IO Weekly Technicals Review [2024/50]: Stimulus Rally FizzlesSGX TSI Iron Ore CFR China (62% Fe Fines) Index Futures (“SGX IO Futures”) expiring in Jan 2025 rose last week closing USD 1.95/ton higher by Friday.
SGX IO Futures opened at USD 102.85/ton on 09/Dec (Mon) and closed at USD 104.80/ton on 13/Dec (Fri).
Prices briefly touched a weekly high of USD 107.30/ton on 10/Dec (Tuesday) and a low of USD 102.55/ton on 09/Dec (Mon). It traded in a range of USD 4.75/ton during the week which was wider than the prior week.
Prices tested the R2 pivot point on 10/Dec (Tue) but failed to pass the level. Price maintained support above the R1 pivot point of 104.75 till the end of the week.
Volume peaked on 10/Dec (Tue) driven by the expanded stimulus announcement in China.
SGX Iron Ore Futures Fundamentals in Summary
IO started the week on a positive note with prices rallying 3% on 09/Dec (Mon) driven by news of expanded stimulus expected to arrive from the Central Economic Work Conference in China.
Despite the rally on 09/Dec (Mon), economic releases on the day showed CPI declining 0.6% MoM (-0.4% E and -0.3% P) during November. Annual CPI also decelerated to 0.2% (0.5% E and 0.3% P) suggesting that the economy continues to be plagued by low domestic consumption.
On 13/Dec (Fri), further economic data from China showed new loans decline 47% YoY to 580 billion yuan in November. Although the figure was 16% higher MoM, the annual decline shows low loan demand. Particularly, new housing and housing related loans remain subdued signaling a potential headwind to IO prices.
On 12/Dec (Thu), China officially announced it would increase the budget deficit, issue more debt, and loosen monetary policy to stimulate the economy and maintain a stable economic growth rate. There were also reports that Chinese policymakers were considering allowing the Yuan to weaken next year to combat punitive trade measures expected from the US.
Iron Ore imports to China fell 1.9% MoM in November to 101.862 million tons. The figure remains 3.9% higher YoY with the YTD figure 4.3% higher. Iron ore imports are expected to rebound in December.
Iron Ore portside inventories rose by 820k tons WoW to 146.66 million tons according to data from SMM. The increase was driven by a significant increase in port arrivals which offset a smaller increase in pickup volume. Maintenance may lead to a further buildup next week.
Based on seasonality, SGX IO Futures Jan contract trades 14.6% below its last 5-year average (USD 121.73/ton). Seasonal trends suggest a rally in the coming weeks.
Short-Term Moving Averages Signal Reversal of Bullish Trend
The 9-day moving average headed higher due to the rally at the start of last week. The price decline in the later part of the week led to a reversal as the 9-day MA is now curving downwards and approaching the 21-day moving average.
Long-Term Averages Signal Retest of 200-day MA
Price tested the 200-day moving average once again last week and managed to surpass it for some time before reversing and heading lower once again. Price remains well above the 100-day moving average which may provide support in case of a decline.
MACD Points to Fading Rally
Relative Strength Index (RSI) at 51.67 signals a neutral level. However, RSI has continued to trend lower since it signaled a crossover with its MA late last week. MACD is narrowing from its positive level and is close to marking a bearish crossover between the 12-day and 26-day MA which could signal a period of decline.
Volatility Rebounds from 1Y Low, Fibonacci 50% Signals Resistance
Volatility rebounded from its 1Y low last week to edge slightly higher to 19.19. Though, volatility still remains muted. Last week, prices retested the 50% Fibonacci level at USD 105.4/ton once more which continues to act as resistance.
Chart Signals Flat Top Pattern
The IO futures chart signals a flat top technical pattern with prices having tested the USD 107/ton level multiple times. The lower and of the range shows a widening channel which could suggest a lower low than previously seen in mid-November.
Hypothetical Trade Setup
Iron Ore prices surged early last week but gave up some gains by the end of the week. Prices retested its resistance levels once more but were rejected. Price also significantly lags the seasonal trend suggesting that the end-year seasonal rally may not materialize this year. Last week’s stimulus announcement failed to provide long-lasting momentum to the rally and prices are trending lower once more at the start of the week.
The declining flat top chart pattern suggests that prices could head lower this time around. This provides a favorable entry for a short position in Iron Ore. However, given significant support levels above that, it may be prudent to choose a slightly higher target.
We propose a hypothetical trade set up of selling SGX IO January Futures Contract at USD 105.00/ton with a stop at USD 108/ton and target at USD 100/ton resulting in reward-to-risk ratio of 1.67x. Each lot of SGX IO Futures Contract provides exposure to 100 tons of iron ore. For each lot, the hypothetical trade would result in gain of USD 500/lot ((105 – 100) x 100) while exposing the trade to a loss of USD 300/lot. This calculation excludes transaction costs comprising of clearing broker fees and exchange clearing fees. The SGX requires a minimum initial margin of USD 1,188/lot and a maintenance margin of USD 1,080/lot.
DISCLAIMER
This case study is for educational purposes only and does not constitute investment recommendations or advice. Nor are they used to promote any specific products, or services.
Trading or investment ideas cited here are for illustration only, as an integral part of a case study to demonstrate the fundamental concepts in risk management or trading under the market scenarios being discussed. Please read the FULL DISCLAIMER the link to which is provided in our profile description.

IO Weekly Technicals Review [2024/49]: Near Term Bearish Trend
SGX TSI Iron Ore CFR China (62% Fe Fines) Index Futures (“SGX IO Futures”) expiring in Jan 2025 fell last week closing USD 1.85/ton lower by Friday.
SGX IO Futures opened at USD 104.4/ton on 02/Dec (Mon) and closed at USD 102.55/ton on 06/Dec (Fri).
Prices briefly touched a weekly high of USD 105.70/ton on 04/Dec (Wed) and a low of USD 102.25/ton on 06/Dec (Fri). It traded in a range of USD 3.45/ton during the week.
Prices traded above the pivot point for most of the week but did not manage to pass the R1 weekly pivot point of USD 106.05/ton. Price dipped below the pivot point of USD 103.20/ton on 06/Dec (Fri)
Volume peaked on 04/Dec (Wed).
Fundamentals in Summary
Caixin’s China manufacturing PMI rose to 51.5 in November from 50.3 in the prior month, above analyst expectations of a 50.6 reading and the highest reading since June. PMI data has shown a continued recovery in the manufacturing sector over the past 3 months reflecting improved demand following the stimulus announcement.
Caixin China non-manufacturing PMI eased to 51.5 from 52 reflecting a slowdown in the service sector.
This week, traders will be watching for the CPI release for November on 9/Dec (Mon). In October, CPI fell 0.3% MoM and eased to 0.3% YoY, its lowest reading since June reflecting continued struggles in domestic demand.
The annual Central Economic Work Conference is scheduled for 11/Dec (Wed) where leaders are expected to map out economic targets and stimulus plans. Rumors that a higher-than-usual deficit target for 2025 could be set spurred a rally in Chinese stocks last week.
IO China Portside inventories fell by 100k tons to 150.4 million tons in the week ending 6/Nov, extending its decline from the prior week according to data from the CISA. Elevated inventory levels could limit demand for further imports.
SMM expects construction to enter its traditional off-season in December with no new projects scheduled for now. However, several major central government meetings and the year-end housing project delivery remain key events to watch and could catalyze a rally.
Based on seasonality, SGX IO Futures Jan contract trades 13.4% below its last 5-year average (USD 118.94/ton). Seasonal trends suggest a rally in the coming weeks.
Short-Term Moving Averages Signal Fading Bullish Trend
While the 9-day moving average has remained above the 21-day MA since marking a bullish MA crossover on 29/Nov, the price decline in the later part of last week drove price below the 9-day MA and it has started to flatten suggesting the rally may be losing steam. Price trades above the 21-day MA which could serve as a support level.
Long-Term Averages Signal Reversal from 200-day MA
Price tested the 200-day moving average last week but the level acted as resistance with price failing to pass it. Price remains well above the 100-day MA at 100.31. However, if the 21-day MA fails to provide support, this level could be tested next.
MACD Points to Fading Rally
Relative Strength Index (RSI) at 51.04 signals a neutral level. However, the RSI marked a crossover with its MA suggesting the price could face a period of negative returns. MACD is narrowing from its positive level and is close to marking a bearish crossover between the 12-day and 26-day MA which could signal a period of decline.
Volatility Eases to 1Y Low, Fibonacci 50% Signals Resistance
Volatility continued to decline and reached its lowest level in more than a year. Last week, prices retested the 50% Fibonacci level at USD 105.4/ton once more which has previously acted as resistance. With price declining, it could suggest a continuation of the bearish trend following the rejection at the Fibonacci level.
Prices at Top End of Declining Channel
Prices have traded in a declining parallel channel following the stimulus driven rally in late-September. Prices are currently just below the top end of the parallel channel which could represent a favorable entry level for a short position.
Hypothetical Trade Setup
Iron Ore prices reversed the early week gains last week to end the week lower. 12-day and 26-day MA are close to signaling a bearish crossover following the price rejection at the 200-day moving average last week. This could signal a near-term bearish trend. With prices at the top end of a declining channel, this could provide a favorable entry for a short position. However, given the low volatility and the strong support at USD 100/ton, the decline could be smaller than previous weeks.
We propose a hypothetical trade set up of selling SGX IO January Futures Contract at USD 103/ton with a stop at USD 105.5/ton and target at USD 100/ton resulting in reward-to-risk ratio of 1.2x. Each lot of SGX IO Futures Contract provides exposure to 100 tons of iron ore. For each lot, the hypothetical trade would result in gain of USD 300/lot ((103 – 100) x 100) while exposing the trade to a loss of USD 250/lot. This calculation excludes transaction costs comprising of clearing broker fees and exchange clearing fees. The SGX requires a minimum initial margin of USD 1,188/lot and a maintenance margin of USD 1,080/lot.
DISCLAIMER
This case study is for educational purposes only and does not constitute investment recommendations or advice. Nor are they used to promote any specific products, or services.
Trading or investment ideas cited here are for illustration only, as an integral part of a case study to demonstrate the fundamental concepts in risk management or trading under the market scenarios being discussed. Please read the FULL DISCLAIMER the link to which is provided in our profile description.

IO Weekly Technicals Review [2024/48]: Bullish Trend to PersistSGX TSI Iron Ore CFR China (62% Fe Fines) Index Futures (“SGX IO Futures”) rose last week, closing USD 4.17/ton higher by 29/Nov (Fri).
SGX IO Futures opened at USD 99.85/ton on 25/Nov (Mon) and closed at USD 104.02/ton on 29/Nov (Fri).
Prices briefly touched a weekly high of USD 104.85/ton on 29/Nov (Fri) and a low of USD 99.80/ton on 25/Nov (Mon). It traded in a range of USD 5.05/ton during the week.
Prices traded above the pivot point of USD 99.30/ton for the entire week and closed above the R1 point of USD 102.90/ton.
Volume peaked on 28/Nov (Thu), as iron ore prices declined gently. The market balanced optimism in China’s steel market against disappointing economic data.
Iron Ore Fundamentals in Summary
Iron ore prices posted a second weekly gain on 29/Nov (Fri), driven by signs of recovery in China’s steel industry and expectations of further stimulus from Beijing by year-end.
Losses at Chinese mills narrowed in October, supported by government growth measures, but overcapacity and weak property demand keep steel among the economy's worst-performing sectors.
Cumulative losses in China’s steel industry dropped to 23 billion yuan (USD 3 billion) in the first 10 months, down from 34 billion yuan over nine months.
China’s manufacturing PMI for November came in at 50.3, beating analyst expectations of 50.2 and last month’s figure of 50.1.
China's port iron ore stockpiles dropped 1.5% to 148.5 million tons in the week ending 29/Nov, according to Steelhome data.
Based on seasonality, SGX IO Futures Jan contract trades 6.9% below its last 5-year average (USD 111.12/ton).
Short-Term Moving Averages Indicate Reversal in Bearish Trend
The gap between the 9-day and 21-day moving averages narrowed earlier in the week, culminating in a golden cross on 28/Nov, when the 9-day moved above the 21-day. This signals the potential onset of a bullish trend.
Long-Term Averages Signal Growing Bullish Trend
IO prices closed below the 200-day Displaced Moving Average (DMA) and oscillated between the 200d-DMA and 100d-DMA throughout the week. Prices are inching towards the 200d-DMA at USD 105/ton which could act as near-term price resistance.
MACD Points to Strengthening Bullishness, RSI Grew But Still Neutral
The MACD indicated a strengthening bullish trend throughout last week. Meanwhile, the RSI is at 54.13, signaling a neutral trend treading just above the midpoint, while the RSI-based moving average is at 49.44.
Volatility Declines, Price Tests 50% Fibonacci Level
Volatility declined sharply last week. Prices broke above the 38.2% Fibonacci level to test the 50% level & held resistance there. With upward momentum since 18/Nov (Mon), support is now expected at USD 103.15/ton (38.2% retracement), with resistance at USD 105.40/ton.
Selling Pressure Eased, Price Trading at High Volume Nodes
Selling pressure remains dominant but has eased compared to last week, according to the Accumulation/Distribution (A/D) indicator. The price trades at a high-volume node, which may act as resistance or support this week.
Iron Ore Prices Set to Climb Ahead of Lunar New Year
Iron ore prices generally increase in November and December due to seasonal patterns that prompt restocking in anticipation of China's Lunar New Year, driven by higher demand for steel production. Since 2014, the average growth has been 7.6%.
Hypothetical Trade Setup
With seasonally strong demand ahead of the Lunar New Year, improving conditions for Chinese steelmakers, expectations of further stimulus, and a stronger-than-expected manufacturing PMI, iron ore prices are poised to rise. To express a bullish view with limited risk, consider a bullish put spread using SGX IO options.
This strategy involves selling a put at a higher strike (USD 99/ton) to collect premiums of protection against downside risk. To limit the downside risk, the second leg of the trade involves buying a put at a lower strike (USD 95/ton). This offers a fixed reward-to-risk profile.
A hypothetical setup with a short put at USD 99/ton and a long put at USD 95/ton, expiring on 31/Jan, provides a maximum upside of USD 118/lot (if IO prices remain above USD 99/ton). This strategy exposes the investor to a max loss of USD 282/lot (if IO prices drop below USD 95/ton). The breakeven for the trade is at USD 97.82/ton.
Option premiums are based on settlement prices as of the close of markets on 29th November 2024.
DISCLAIMER
This case study is for educational purposes only and does not constitute investment recommendations or advice. Nor are they used to promote any specific products, or services.
Trading or investment ideas cited here are for illustration only, as an integral part of a case study to demonstrate the fundamental concepts in risk management or trading under the market scenarios being discussed. Please read the FULL DISCLAIMER the link to which is provided in our profile description.

IO Weekly Technicals Review [2024/47]: Uptrend to ContinueSGX TSI Iron Ore CFR China (62% Fe Fines) Index Futures (“SGX IO Futures”) rose last week, closing USD 3.83/ton higher by 22/Nov (Fri).
SGX IO Futures opened at USD 96.75/ton on 18/Nov (Mon) and closed at USD 100.58/ton on 22/Nov (Fri).
Prices briefly touched a weekly high of USD 102.70/ton on 22/Nov (Fri) and a low of USD 95.80/ton on 18/Nov (Mon). It traded in a range of USD 6.90/ton during the week, which was smaller than the prior week.
Prices traded above the pivot point of USD 98.80/ton for the entire week and closed below the R1 point of USD 101.35/ton.
Volume peaked on 18/Nov (Mon), as iron ore prices surged, fueled by the seasonal trend of increased restocking ahead of the Lunar New Year.
Iron Ore Fundamentals in Summary
Iron ore prices remain well supported despite high stockpiles at Chinese ports thanks to strong consumption and robust Q4 steel production.
Inventory levels at major Chinese steel mills rose 13.84% to 15.6 MMT in mid-November compared to early November, according to the China Iron and Steel Association.
Volumes were 1.4% higher than the same period last year. Meanwhile, daily crude steel production at major Chinese steelmakers decreased by 0.8% from early November.
China's central bank maintained its key lending rates unchanged last week, aligning with expectations.
Increased iron ore shipments from major exporters like Australia, coupled with growing stockpiles at Chinese ports, exerted downward price pressure during the second half of last week.
Chinese portside inventories grew by 350k tons WoW to 148.86M tons last week.
Based on seasonality, SGX IO Futures Jan contract trades 7.8% below its last 5-year average (USD 109.87/ton).
Short-Term Moving Averages Continue to Indicate Bearish Trend
The gap between the 9-day and 21-day moving averages widened over the week as the 9-day average continued to decline. Iron ore prices ended the week above the 9-day average but below the 21-day average.
Long-Term Averages Signal Reversal of Bearish Trend
The price closed slightly above the 100-day moving average (DMA) but remained significantly below the 200 DMA. It began the week well below the 100 DMA but steadily climbed to surpass it by the week’s end.
MACD Points to Weakening Bearishness, RSI Remains Neutral
The MACD indicated a weakening bearish trend by the end of last week. Meanwhile, the RSI is at 49.56, signaling a neutral trend treading just below the midpoint. Notably, RSI has stayed above its RSI-based moving average since 19/Nov (Tue).
Volatility Declines, Price Tests the Fibonacci 38.2% Level
Volatility declined steadily throughout the week. Prices broke above the 23.6% Fibonacci level to test the 38.2% level & held resistance there. With upward momentum since 18/Nov (Mon), resistance is now expected at USD 103.15/ton (38.2% retracement), with support at USD 100.35/ton.
Selling Pressure Eased, Price Trading at High Volume Nodes
Selling pressure remains dominant but has eased compared to last week, according to the Accumulation/Distribution (A/D) indicator. The price is trading at a high-volume node previously dominated by sell volume, which may act as resistance or support this week.
Hypothetical Trade Setup
With the seasonal upswing in iron ore prices ahead of the Lunar New Year, demand is expected to remain strong. China’s Manufacturing PMI on 29/Nov (Fri) could spike up volatility. Long futures position exposes investors to downside risk if PMI disappoints. An alternative way to express a bullish view is through a bullish call spread using SGX IO options.
This strategy involves buying a lower strike call and selling a higher strike call, offering a fixed upside and downside with a smaller premium cost than a long call. A hypothetical setup with a long call at USD 102/ton and a short call at USD 104/ton, expiring 31/Jan, offers a 1.67x reward-to-risk ratio. This position provides a max profit of USD 125/lot, a max loss of USD 75/lot, and breaks even at USD 102.75/ton.
DISCLAIMER
This case study is for educational purposes only and does not constitute investment recommendations or advice. Nor are they used to promote any specific products, or services.
Trading or investment ideas cited here are for illustration only, as an integral part of a case study to demonstrate the fundamental concepts in risk management or trading under the market scenarios being discussed. Please read the FULL DISCLAIMER the link to which is provided in our profile description.

IO Weekly Technicals Review [2024/46]: IO to Rise on SeasonalitySGX TSI Iron Ore CFR China (62% Fe Fines) Index Futures (“SGX IO Futures”) plunged last week, closing USD 5.49/ton lower by 15/Nov (Fri). Iron ore prices faced their steepest weekly drop since September.
SGX IO Futures opened at USD 102.20/ton on 11/Nov (Mon) and closed at USD 96.71/ton on 15/Nov (Fri).
Prices briefly touched a weekly high of USD 103.46/ton on 11/Nov (Mon) and a low of USD 96.30/ton on 15/Nov (Fri). It traded in a range of USD 7.16/ton during the week, which was bigger than the prior week.
Prices traded below the pivot point of USD 103.25/ton for the entire week and closed below the S2 point of USD 98.05/ton.
Volume peaked on 15/Nov (Fri) as Iron Ore prices declined due to a fall in China’s housing prices and industrial production.
Iron Ore Fundamentals in Summary
China's steel output rose in October, driven by increased orders following Beijing's economic package, while exports hit a near-decade high.
Despite this, long-term prospects remain weak, with China projected to account for less than half of global steel consumption in 2024 for the first time in six years, according to the World Steel Association.
China's housing prices fell 5.9% YoY in Oct, deepening from a 5.8% drop in Sep. Industrial production grew 5.3% YoY, missing analyst expectations of 5.5% and slightly below the 5.4% growth in Sep.
Chinese portside inventories grew by 120k tons WoW to 148.51M tons last week. The average daily port discharge volume grew by 131k tons WoW to 3.18M tons.
Based on seasonality, SGX IO Futures Dec contract trades 3.7% below its last 5-year average (USD 103.92/ton).
Short-Term Moving Averages Indicate Bearish Trend
The 9-day moving average crossed below the 21-day on 14/Nov (Thu), forming a death cross. This signal, coupled with price declines on 14/Nov (Thu) and 15/Nov (Fri), indicated a potential bearish trend.
Long-Term Averages Signal Persistent Bearish Trend
The price closed below the 100-day moving average (DMA) on 11/Nov (Mon) and stayed below it all week, trading beneath both the 100 and 200 DMAs. This contrasts with the previous week, where it fluctuated between the two.
MACD Points to Continued Bearishness, RSI Remains Neutral
MACD signaled a bearish trend at the end of the week. RSI is slightly lower than the mid-point level at 44.65 signaling a neutral trend. The RSI has remained below the RSI-based MA since 07/Nov (Thu).
Volatility Remains Moderate, Price Tests the Fibonacci 23.6% Level
Volatility gradually edged up throughout the week, while remaining moderate. The 23.6% Fibonacci level was tested last week and managed to hold resistance on the level. With the downtrend from 15/Nov (Fri) reversing on 18/Nov (Mon), the new resistance level can be expected at USD 100.75/ton (23.6% retracement) and support at USD 96.3/ton.
Selling Pressure Intensified, Price Trading at Low Volume Nodes
Selling pressure grew stronger last week based on the Accumulation/Distribution indicator (A/D). Price trades at a low-volume node which was dominated by sell volume, which could act as a resistance or support this week. The price closed below its lower Bollinger band on 15/Nov (Fri).
Iron Ore Prices Poised to Rise Ahead of Lunar New Year
Iron ore prices typically rise in November and December as seasonal trends drive restocking ahead of China's Lunar New Year, fueled by increased demand for steel production.
Hypothetical Trade Setup
As noted earlier, iron ore prices typically increase ahead of the Lunar New Year due to heightened restocking driven by stronger demand, with the Lunar New Year set for 29/Jan/2025.
To capitalize on this seasonal trend, we propose a hypothetical trade setup of buying SGX IO January Futures Contract at USD 99/ton with a stop at USD 94/ton and target at USD 106.5/ton resulting in a reward-to-risk ratio of 1.50x. This calculation excludes transaction costs comprising clearing broker fees and exchange clearing fees.
DISCLAIMER
This case study is for educational purposes only and does not constitute investment recommendations or advice. Nor are they used to promote any specific products, or services.
Trading or investment ideas cited here are for illustration only, as an integral part of a case study to demonstrate the fundamental concepts in risk management or trading under the market scenarios being discussed. Please read the FULL DISCLAIMER the link to which is provided in our profile description.

IO Weekly Technicals Review [2024/45]: Bearish Trend to PersistSGX TSI Iron Ore CFR China (62% Fe Fines) Index Futures (“SGX IO Futures”) fell last week, closing USD 0.29/ton lower by 08/Nov (Fri). Price fell by 1.67% to USD 100.85/ton on 11/Nov (Mon).
SGX IO Futures opened at USD 102.85/ton on 04/Nov (Mon) and closed at USD 102.56/ton on 08/Nov (Fri).
Prices briefly touched a weekly high of USD 106.20/ton on 08/Nov (Fri) and a low of USD 101/ton on the same day. It traded in a range of USD 5.20/ton during the week, which was bigger than the prior week.
Prices traded above the pivot point of USD 102.70/ton for the entire week and tested the R2 point of USD 106/ton.
Volume peaked on 08/Nov (Fri) as Iron Ore prices declined due to China’s stimulus measures disappointing expectations.
Iron Ore Fundamentals in Summary
China's National People’s Congress unveiled a USD 1.4 trillion debt swap to ease local government debt burdens, but the lack of housing market and consumer stimulus disappointed investors, causing Chinese equities to fall.
China’s CPI for Oct grew 0.3% YoY but fell by 0.3% MoM. On a YoY and MoM basis, its CPI declined compared to last month, suggesting a persistent weakness to consumption in the country. Additionally, its PPI fell by 2.9% YoY, lower than analyst expectations of a 2.5% decline.
On 14/Nov (Thu), China’s housing prices and industrial production figures for Oct will be released, which could lead to volatility.
Chinese portside inventories fell by 1.71M tons to 148.39M tons last week. The decline was despite a fall in procurement as the average daily port discharge volume fell by 37k tons WoW to 3.05M tons.
Based on seasonality, SGX IO Futures Dec contract trades 0.37% above its last 5-year average (USD 101.08/ton).
Short-Term Moving Averages Indicate Bearish Trend Despite Golden Cross
The 9-day moving average rose early in the week, crossing above the 21-day moving average on 05/Nov (Tue) creating a golden cross. However, the subsequent drop in prices on 08/Nov suggests a false trigger.
Long-Term Averages Signal Bearish Trend As Prices Fall Below 100 DMA
Price traded between the 100-day moving average and 200-day moving average throughout last week. However, the price fell below the 100-day moving average on 11/Nov (Mon).
MACD Points to Bearishness, RSI Remains Flat
MACD signaled a bearish trend at the end of the week. RSI is slightly lower than the mid-point level at 47.41 signaling neutral trend. The RSI fell below the RSI-based MA on 07/Nov (Thu).
Volatility Remains Low, Price Tests the Fibonacci 50% Level
Volatility was moderate throughout the week but edged up 08/Nov (Fri). The 50% Fibonacci level was tested last week and managed to hold resistance on the level. With the downtrend from 08/Nov (Fri) carrying forward, the new resistance levels can be new S1 and S2 levels at USD 100.30/ton and USD 98.05/ton.
Selling Pressure Persists, Price Trading at High Volume Levels
Heavy selling pressure based on the Accumulation/Distribution indicator (A/D). Price trades at a high-volume node which was dominated by sell volume, which could act as a resistance or support this week. The price is closer to its lower Bollinger band.
Hypothetical Trade Setup
Iron ore prices fell last week as China’s financial measures disappointed, sustaining a bearish trend that could persist. Upcoming October housing and industrial data may add volatility, with potential for a rebound if housing data beats expectations.
To express a bearish view with limited risk, investors could consider an SGX iron ore put spread, buying a USD 99/ton put and selling a USD 96/ton put for the 31/Dec expiry. This strategy offers a reward-to-risk ratio of 1.6x, with a potential gain of USD 185 and a maximum loss of USD 115 per 100-ton lot (excluding transaction costs).
DISCLAIMER
This case study is for educational purposes only and does not constitute investment recommendations or advice. Nor are they used to promote any specific products, or services.
Trading or investment ideas cited here are for illustration only, as an integral part of a case study to demonstrate the fundamental concepts in risk management or trading under the market scenarios being discussed. Please read the FULL DISCLAIMER the link to which is provided in our profile description.

IO Weekly Technicals Review [2024/44]: Set For Large Move SGX TSI Iron Ore CFR China (62% Fe Fines) Index Futures (“SGX IO Futures”) expiring in December rose last week, up by USD 0.54/ton on Friday, though prices gave up some gains by the end of the week.
SGX IO Futures opened at USD 101.60/ton on 28/Oct (Mon) and closed at USD 102.14/ton on 01/Nov (Fri).
Prices briefly touched a weekly high of USD 104.60/ton on 29/Oct (Tue) and a low of USD 101.30/ton on 28/Oct (Mon). It traded in a range of USD 3.30/ton during the week, which was smaller than the prior week.
Prices traded just above the pivot point of USD 103.70/ton for most of the week before falling below it on Friday.
Volumes were noticeably lower in the later part of the week. Highest volume was observed on 30/Oct (Wed).
SGX Iron Ore Futures Fundamentals in Summary
China’s parliament has started its five-day meeting on 4/Nov (Mon) and is expected to announce the details of the fiscal support on 8/Nov (Fri). Analysts suggest the fiscal plan could reach 10 trillion yuan (USD 1.4 trillion), with most funds likely allocated to refinancing local government debt. The outcome is likely to drive significant volatility during the week.
China’s manufacturing PMI rose from 49.8 to 50.1 in Oct as the manufacturing sector shifted into expansion after 5 months of contraction. Non-manufacturing PMI also rose to 50.2 from 50.0.
Steel industry PMI rose to 54.6 from 49 in prior month. The PMI reading was the highest since July 2018. The output index rose to 63.6 suggesting the stimulus helped boost steel production.
Caxin’s China manufacturing PMI rose from 49.3 to 50.3 in October recovering from the dip in September.
IO China Portside inventories rose by 770k tons to 150.1 million tons last week. The pickup volume declined further by 13k tons. Accumulating inventories pose a risk to IO demand.
Based on seasonality, SGX IO Futures Dec contract trades 3.6% higher than its last 5-year average (USD 99.31/ton).
Short-Term Moving Averages Signal Bearish Trend
Prices recovered following the bearish MA crossover on 22/Oct but failed to rise above the 21-day moving average. The 21-day moving average served as a resistance level throughout last week.
Long-Term Averages Provide Support
Prices shot above the 100-day moving average on 28/Oct (Mon) and managed to hold above this level for the rest of the week. Price re-tested this support level on 4/Nov (Mon) but seems to be holding above it for now.
MACD Points to Fading Decline
The MACD suggests a weakening bearish trend, with the short-term MA positioned just below the long-term MA. However, both MAs are trending downward, making a bullish crossover unlikely without a sharp rally. The long-term MA may serve as support. The RSI is near a neutral level at 51.02.
Fibonacci 38.2% Tested Last Week
Following the retracement of the bearish trend since the start of October, prices rallied to the 38.2% Fib level but failed to surpass it. This could indicate a continuation of the bearish trend. Though, the USD 100/ton level may provide psychological support.
Price Trading Just Below Volume Point of Control
Sellers continued to dominate trading despite an uptick in buyers early last week. Price faced resistance at the volume point of control for October (USD 103.55/ton). There is another area of volume concentration at (USD 101.15/ton) which could provide near-term support.
Bollinger Bands Narrowing with Low Volatility
Bollinger Bands for IO futures are narrowing and their width is near the lowest contraction since August, increasing the likelihood of a sharp breakout. Price is currently at the mid-point of the Bollinger Bands. Historical Volatility also continued to decline last week and reached its lowest level since August.
Iron Ore Options Favor Calls
SGX IO options expiring in December have an OI put/call ratio of 0.86 as of 1/Nov which favors calls. Over the past week, trading in this contract was heavily skewed towards call with a volume put/call ratio of 0.38. Additionally, last week, near-term options expiring in November saw a large buildup of call options around the USD 105 strike suggesting bullish sentiment in the near-term. The delta-25 options skew for December options also shows a sharp increase in call IV alongside a narrowing skew suggesting high demand for calls.
Hypothetical Trade Setup
Iron Ore volatility has reached its lowest level since August. The rally last week failed to continue past the short-term moving average and the volume profile point of control and IO gave up substantial gains in the later part of the week despite the encouraging data from PMI releases. The results of the ongoing parliamentary meeting are expected on 9/Nov (Fri) and are likely to drive substantial moves in prices. Options activity over the last week showed a high concentration of activity for call options, especially at the strike level of USD 105/ton. The IV for IO options has also been rising unlike the historical volatility. A sharp upside move is likely, though, if the fiscal stimulus disappoints, prices may also decline sharply.
Expressing the bullish view through a long futures exposes the position to higher risk if stimulus disappoints. Investors can instead express the bullish view using SGX IO options. A bullish call spread benefits from an increase in prices and offers a fixed upside and fixed downside along with a smaller premium cost than a long call position. Bullish call spread consists of long call at a lower strike and short call at a higher strike. A hypothetical trade setup consisting of USD 105/ton for the long call leg and USD 109/ton for the short call leg on the options contract expiring on 31/Dec offers a reward to risk ratio of 3x. The USD 109/ton level coincides with the peak during the last rally in mid-October and is close to the 200-day moving average, prices could face resistance above this level. This position offers a max profit of USD 299/lot and a max loss of USD 101/lot and breaks even when prices rise above USD 106.1/ton.
DISCLAIMER
This case study is for educational purposes only and does not constitute investment recommendations or advice. Nor are they used to promote any specific products, or services.
Trading or investment ideas cited here are for illustration only, as an integral part of a case study to demonstrate the fundamental concepts in risk management or trading under the market scenarios being discussed. Please read the FULL DISCLAIMER the link to which is provided in our profile description.

IO Weekly Technicals Review [2024/43]: Term Structure Divergence
SGX TSI Iron Ore CFR China (62% Fe Fines) Index Futures (“SGX IO Futures”) closed nearly flat last week, down by just USD 0.10/ton on Friday after recovering from a mid-week decline.
SGX IO Futures opened at USD 101.65/ton on 21/Oct (Mon) and closed at USD 101.55/ton on 25/Oct (Fri).
Prices briefly touched a weekly high of USD 103.45/ton on 21/Oct (Mon) and a low of USD 98.10/ton on 24/Oct (Thu). It traded in a range of USD 5.35/ton during the week, which was smaller than the prior week.
Prices traded below the pivot point of USD 103.35/ton for the entire week but managed to hold support above the S1 pivot point at 97.65.
Volume peaked on 25/Oct (Fri) as Iron Ore prices rallied from near their low following the announcement of a parliamentary meeting to discuss the stimulus package between 4/Nov and 8/Nov.
SGX Iron Ore Futures Fundamentals in Summary
Iron Ore received support in the later part of the week from the announcement of a parliamentary meeting to discuss the stimulus package in China which will take place between 4/Nov and 8/Nov.
The People's Bank of China also said in a statement it had activated the open market outright reverse repo operations facility to "maintain a reasonable abundance of liquidity in the banking system and further enrich the central bank's policy toolbox“ ahead of a significant loan expiry at the end of the year.
IO China Portside inventories declined by 400k tons to 149.33 million tons last week. The decline was driven by slower arrivals as pickup volume declined week on week and steel mill’s restocking pace was below analyst expectations.
Based on seasonality, SGX IO Futures Nov contract trades 2.6% below its last 5-year average (USD 105.58/ton).
Seasonal Trend also suggests a price low is expected in the next few weeks.
Short-Term Moving Averages Signal Reversal of Bullish Trend
Prices began the week on a downward trend, marked by a bearish moving average (MA) crossover on 22/Oct (Tue). After the crossover, prices declined 3%, briefly dipping just above the S1 Pivot Point before recovering sharply on 25/Oct (Fri). On 28/Oct (Mon), prices are trading slightly below the 21-day moving average and the R1 Pivot Point for the week.
Long-Term Averages Signal Bearish Trend
Last week, the price traded below the 100-day moving average, closing just under this level. On 28/Oct (Mon), it rose sharply above the 100-day moving average but remains about 5% below the 200-day moving average.
MACD Points to Fading Decline, RSI Trending Higher
MACD indicates that the bearish trend is weakening, with the short-term MA beginning to curve upward toward the long-term MA. This suggests a potential consolidation around the long-term MA or a bullish crossover if momentum strengthens. Meanwhile, the RSI recently crossed above its 14-day average but remains near the midpoint at 53.84.
Fibonacci 61.8% Maintained Support Last Week
Volatility increased throughout the week but remains below early October levels. Last week, the price tested and held support at the 61.8% Fibonacci level from the prior uptrend. Fib levels from the recent downtrend suggest that the price may next retest the 38.2% level. The 61.8% level remains noteworthy, as it has previously acted as a key area of interest.
Low-Volume Node May Drive Sharp Upward Move
Despite ongoing selling pressure, buyers rebounded sharply in the latter part of the week. The price is currently at a low-volume node and could rise quickly toward the point of control, which aligns with the 50% Fibonacci level.
Calendar Spread Shows Deviation from Backwardation
The recent price movement has created a premium on the April 2025 contract compared to the second-month contract (Nov 2024). A return to the usual backwardation structure is expected. Additionally, speculation over the next two weeks, driven by the upcoming parliamentary meeting, will likely focus on the more liquid Nov 2024 contract, which should further support the spread.
Hypothetical Trade Setup
Iron Ore prices received some support from the announcement of further monetary easing and hopes of further stimulus at the parliamentary meeting next week. The rally has reversed the consistent decline in IO over the past 3 weeks but outlook remains bearish as the impact of stimulus on prices has weakened since early October. In the near-term, stimulus expectations may drive a rally clouding the outlook for a straightforward short position.
We propose a hypothetical trade set up of buying SGX IO November Futures Contract at USD 102.90/ton and selling the SGX IO April 2025 Futures contract at USD 103.60/ton to capitalize on the normalization of the backwardated term structure.
Presently the Nov/April ratio is at 0.99324. An increase to 1.025 presents a 3.25% increase in the spread which results in a gain of USD 321 to USD 330. A stop loss at the ratio of 0.975 protects in case of further decline with a potential loss of USD 189 to USD 194. This calculation excludes transaction costs comprising of clearing broker fees and exchange clearing fees. The SGX requires a minimum initial margin of USD 320/lot and a maintenance margin of USD 352/lot for this intra-commodity spread.
DISCLAIMER
This case study is for educational purposes only and does not constitute investment recommendations or advice. Nor are they used to promote any specific products, or services.
Trading or investment ideas cited here are for illustration only, as an integral part of a case study to demonstrate the fundamental concepts in risk management or trading under the market scenarios being discussed. Please read the FULL DISCLAIMER the link to which is provided in our profile description.

IO Weekly Technicals Review [2024/42]: IO Reversal Deepens
SGX TSI Iron Ore CFR China (62% Fe Fines) Index Futures (“SGX IO Futures”) fell last week for a second week in a row, closing USD 4.15/ton lower by Friday.
SGX IO Futures opened at USD 105.85/ton on 14/Oct (Mon) and closed at USD 101.70/ton on 18/Oct (Fri).
Prices briefly touched a weekly high of USD 109.05/ton on 14/Oct (Mon) and a low of USD 99.30/ton on 17/Oct (Thu). It traded in a range of USD 9.75/ton during the week, which was smaller than the prior week.
Prices traded below the pivot point of USD 108.10/ton for the entire week but managed to hold support above the S1 pivot point at 101.15.
Volume peaked on 17/Oct (Thu) as Iron Ore prices declined despite the announcement of expanded housing stimulus measures.
SGX Iron Ore Futures Fundamentals in Summary
Further measures to support the housing industry in China were announced on 17/Oct (Thu). The measures included widened support under the “white list” program to 4 trillion Yuan.
PBoC started the week with a 25 bps cut to the 5-year loan prime rate and a 25 basis point cut to the 1-year loan prime rate offering additional easing measures. Despite an early rally, IO pared gains by the end of the day.
China's GDP growth in Q3 was 0.9%, falling short of analyst expectations but exceeding the 0.5% growth recorded in Q2, which was revised downward. Annual GDP growth reached 4.6%, significantly below the 5% target.
IO China Portside inventories rose by 1.89M tons to 149.73 million tons last week. The increase was driven by significantly higher arrivals and low pace of pickup due to slower restocking.
Based on seasonality, SGX IO Futures Nov contract trades 3.5% below its last 5-year average (USD 105.58/ton). Seasonal performance also suggests there could be a price dip with a low in the next couple of weeks.
Short-Term Moving Averages Signal Reversal of Bullish Trend
The 9-day moving average is continuing its downward trend and marked a bearish crossover on 21/Oct (Mon). Last week, the price held support above the S1 pivot point but faced rejection at the P pivot point on 21/Oct (Mon).
Long-Term Averages Signal Bearish Trend
Price fell below the 100-day moving average on 17/Oct (Thu). Despite reaching highs above this level, price has failed to close above the MA.
MACD Points to Downturn, RSI Flat
MACD signals an ongoing bearish trend since 16/Oct (Wed) with the distance between long and short-term MA continuing to expand as of 21/Oct (Mon). RSI is at the mid-point level of 49.5 signaling neutral trend.
Volatility Eases, Fibonacci 50% Maintained Support Last Week
Volatility briefly edged up in the middle of last week but now continues to decline and has reached the lowest level in October. The 50% Fibonacci level was tested last week but managed to maintain support. With a continued downward trend, the 61.8% Fibonacci level at 97.55 is the next major support level to watch if price declined below 50%.
Selling Pressure Dominates, Price Gap Likely to be Tested This Week
Heavy selling pressure dominates IO trading according to the Accumulation/Distribution indicator (A/D). Price trades at a high volume node which was dominated by sell volume and below a low volume valley which could be tested during the week. The bullish flag failed to maintain last week as prices fell further instead of consolidating.
Hypothetical Trade Setup
Iron Ore prices continued to decline last week as the expanded stimulus measures disappointed market expectations once again. Bearish trend in IO continues as fundamentals signal more pain in store and short-term MA signaled a bearish crossover.
We propose a hypothetical trade set up of selling SGX IO November Futures Contract at USD 101.2/ton with a stop at USD 104.05/ton and target at USD 97.5/ton resulting in reward-to-risk ratio of 1.30x.
Entry: USD 101.2/ton
Target: USD 104.05/ton
Stop Loss: USD 97.5/ton
Profit at Target: USD 370/lot ((101.2-97.5) x 100)
Loss at Stop: USD 285/lot ((101.2-104.05) x 100)
Reward to Risk: 1.30x
This calculation excludes transaction costs comprising of clearing broker fees and exchange clearing fees. The SGX requires a minimum initial margin of USD 1,232/lot and a maintenance margin of USD 1,120/lot.
DISCLAIMER
This case study is for educational purposes only and does not constitute investment recommendations or advice. Nor are they used to promote any specific products, or services.
Trading or investment ideas cited here are for illustration only, as an integral part of a case study to demonstrate the fundamental concepts in risk management or trading under the market scenarios being discussed. Please read the FULL DISCLAIMER the link to which is provided in our profile description.

Iron ore trend upFor quite some time iron ore has been in a bad market but due to china stimulus now we can see some support for long #vale #riotinto

is steel screwed? nahsteel is fine. tariffs seem to be working. what is the point of these descriptions.

Long SteelI think we will see a nice bullish move in steel closing above and break of structure on futures, would like to see us retrace to golden pocket.

Iron ore futures look heavy after breaking multiple levelsChinese iron ore port inventories are bloated and continue to increase, hitting more than two-year highs last week. When you throw seasonality into the mix, the build is occurring at a time when inventories should be drawing fast. It’s extremely rare, raising questions whether iron ore can hold above $100 when the largest source of steel demand globally – China’s property sector – is on its knees.
From not only a fundamental but technical perspective, SGX iron ore futures look ripe for downside. Having been rejected at resistance at $114 last week, the August 2024 contract has broken the 50-day moving average level, back testing it and then slicing through uptrend support before doing away with horizonal support at $109 on Monday.
Having retested $109 earlier today and failed, a short trade looks in order targeting $102, the low struck in July. The risk reward of selling around these levels is still favourable, although the preference would be to see the price move closer to $109, allowing for a tight stop to be placed above the level for protection. If the trade were to move in your favour, consider lowering your stop to entry level.
DS
