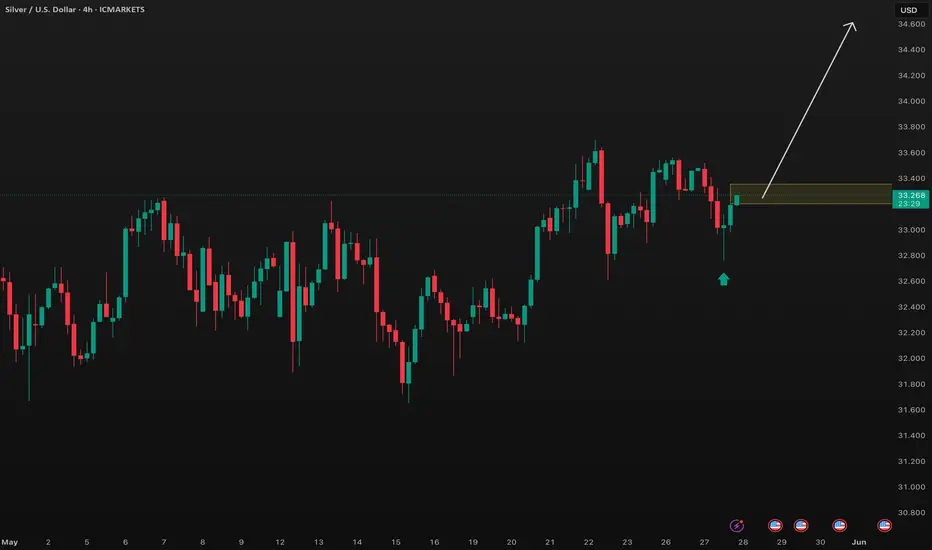
Market next move 🔺 Disruption to Bearish Thesis
1. Strong Bullish Momentum Recently
Recent candles show a series of green bullish candles with increasing size.
Indicates strong buying interest—not a sign of exhaustion, which would support further downside.
2. Volume Spike on Green Candles
Volume surged during the recent bullish candles.
This typically signals accumulation, not distribution — contradicting the bearish outlook.
3. Failure to Break Key Support
Price previously bounced sharply from below 33.0000, showing buyers defended that zone.
This bounce suggests the support is strong, weakening the argument for a move toward the lower target.
4. Reversal Pattern Possible (Double Bottom)
The chart may show early signs of a double bottom or higher low, both bullish reversal signals.
These patterns would negate the bearish projection if confirmed with a higher high.
5. Divergence from US Dollar Weakness
If the US Dollar shows weakness, silver could rally due to its inverse correlation.
The marked target may not be achieved if macro forces support precious metals.
Silver Futures (Continuous futures contract)
36.303USDR
−0.110−0.30%
At close at Jun 13, 19:59 GMT
USD
No trades
SILVER.F trade ideas

XAG/USD finds support as buyers build momentum.Silver price (XAG/USD) halts its losing streak, trading around $33.20 per troy ounce during the Asian hours on Thursday.
There is a good chance silver could retest the immediate support at the twenty-day EMA of $32.87. A push below this level could weaken the short and medium-term price momentum to the downside and put downward pressure on the grey metal around the lower boundary at $31.80.
On the upside, the XAG/USD pair could explore the region around the rectangle’s upper boundary at $33.70, aligned with the seven-week high at $33.71, reached on May 25. A break above this crucial resistance zone could cause the influx of the bullish bias and lead the silver price to approach the seven-month high of $34.60, last seen on March 28.


Silver H1 | Bearish Reversal Based on the H4 chart, the price is approaching our sell entry level at 33.28, a pullback resistance.
Our take profit is set at 32.79, a swing low support.
The stop loss is set at 1.4481, a swing high resistance.
High Risk Investment Warning
Trading Forex/CFDs on margin carries a high level of risk and may not be suitable for all investors. Leverage can work against you.
Stratos Markets Limited (tradu.com ):
CFDs are complex instruments and come with a high risk of losing money rapidly due to leverage. 63% of retail investor accounts lose money when trading CFDs with this provider. You should consider whether you understand how CFDs work and whether you can afford to take the high risk of losing your money.
Stratos Europe Ltd (tradu.com ):
CFDs are complex instruments and come with a high risk of losing money rapidly due to leverage. 63% of retail investor accounts lose money when trading CFDs with this provider. You should consider whether you understand how CFDs work and whether you can afford to take the high risk of losing your money.
Stratos Global LLC (tradu.com ):
Losses can exceed deposits.
Please be advised that the information presented on TradingView is provided to Tradu (‘Company’, ‘we’) by a third-party provider (‘TFA Global Pte Ltd’). Please be reminded that you are solely responsible for the trading decisions on your account. There is a very high degree of risk involved in trading. Any information and/or content is intended entirely for research, educational and informational purposes only and does not constitute investment or consultation advice or investment strategy. The information is not tailored to the investment needs of any specific person and therefore does not involve a consideration of any of the investment objectives, financial situation or needs of any viewer that may receive it. Kindly also note that past performance is not a reliable indicator of future results. Actual results may differ materially from those anticipated in forward-looking or past performance statements. We assume no liability as to the accuracy or completeness of any of the information and/or content provided herein and the Company cannot be held responsible for any omission, mistake nor for any loss or damage including without limitation to any loss of profit which may arise from reliance on any information supplied by TFA Global Pte Ltd.
The speaker(s) is neither an employee, agent nor representative of Tradu and is therefore acting independently. The opinions given are their own, constitute general market commentary, and do not constitute the opinion or advice of Tradu or any form of personal or investment advice. Tradu neither endorses nor guarantees offerings of third-party speakers, nor is Tradu responsible for the content, veracity or opinions of third-party speakers, presenters or participants.

Chart Pattern Analysis Of XAG
K1 and K2 break up the downtrend line of a potential bullish triangle pattern.
If K3 still stand upon the line,
It will be a valid break up.
On the other hand,
If the following candles close below K2 immediately,
K1 will be a fake up candle,
And the risk will sharply increase.
Long-33.4/Stop-33.08/Target-36

Inverse Head and ShouldersSilver going to 38 dollars baby.
We have a confirmed INVERSE
H&S on the daily timeframe.
What are you waiting for?
Florida just passed a bill to
recognize silver and gold as
legal tender! Silver ain't gonna
stay in this area much longer...
Bitcoin to is not gonna just hang
around 107k either...BOTH are
about to PAMP BABY!!!
Good luck and....
************* HAPPY SILVER HUNTING *************

Silver Wave Analysis – 28 May 2025
- Silver reversed from resistance level 33.70
- Likely to fall to support level 31.70
Silver recently reversed from the resistance level 33.70 (which is the upper border of the sideways price range inside which the price has been trading from April).
The resistance area near the resistance level 33.70 was strengthened by the upper daily Bollinger Band.
Silver can be expected to fall to the next support level 31.70 (lower border of the active sideways price, which reversed the previous waves a and 2).


Precision Pays Off: Learn, Trade, Win — Results Speak Louder🎯 Analysis On Point Again!
My recent analysis played out exactly as expected. 📉📈 Those who followed my instructions not only gained profits but also improved their trading knowledge and decision-making skills.
Success in trading isn't just about luck — it's about learning to read the market with precision and discipline. 📚💡
To those who’ve been riding along — congratulations on your gains! 🥂 And to the new followers, stay tuned. The next winning setups are just around the corner.
Let’s grow, learn, and earn — together. 🚀💸


Silver 3 Bar Uptrend Line Now Intact!Hey Traders so today wanted to talk a little about the Silver Market. Just saw my favorite 3 bar trendline on there. Looking very bullish so if one was to trade this I would just wait for market to pull back to trend line before buying. Place your stop loss under that big candle and should be safe.
However if Bearish I would wait until market closes underneath 32.00 or even better 31.50 there is too much buying support above imo. Keep in mind Seasonally in June and July Gold and Silver noramally get increased demand.
Always use Risk Management! (Just in case your wrong in your analysis most experts recommend never to risk more than 2% of your account equity on any given trade.)
Hope This Helps Your Trading 😃
Clifford


SILVER: The Market Is Looking Up! Long!
My dear friends,
Today we will analyse SILVER together☺️
The price is near a wide key level
and the pair is approaching a significant decision level of 33.237 Therefore, a strong bullish reaction here could determine the next move up.We will watch for a confirmation candle, and then target the next key level of 33.339.Recommend Stop-loss is beyond the current level.
❤️Sending you lots of Love and Hugs❤️

Silver (XAG/USD) Analysis Using Mirror Market Concepts + Target📌 Overview:
In this analysis, I’ve applied MMC (Mirror Market Concepts) to Silver’s recent price action. MMC helps traders like us identify symmetry, psychological zones, and repetitive structures in the market. This chart is a textbook example of how buyers and sellers leave patterns behind that we can mirror to predict what comes next.
Let’s dig deep into this elegant setup 👇
📈 1. The Curve Zone Support – Foundation for the Move
At the base of the chart, you’ll notice a curved support zone drawn in black. This isn’t just any random support—this is a rounded structure that shows how price gradually transitioned from bearish to bullish over time.
This Curve Zone Support indicates:
Sellers are getting exhausted.
Buyers are quietly stepping in, absorbing all sell-side pressure.
The market is preparing for an upside breakout.
This zone also aligns with mirror behavior—what price did before, it's setting up to do again.
🟣 2. Mirror Market Concepts in Action
MMC teaches us to reflect past structures into the future. Here’s how it plays out:
Previous dips into the curve zone were followed by strong bullish pushes.
Recent price action mimics earlier structures, forming mini-cups and curved bases.
This behavior suggests that Silver is mirroring its own bullish reversal structure again.
It’s like watching history repeat itself—with new energy.
🟡 3. Demand Zone + Break of Structure (BOS)
Around the $33.00 level, price dipped into a marked demand zone (highlighted in light purple). This is where buyers jumped back in and pushed price up again—proving strong interest at this level.
You’ll also notice a Minor Break of Structure (BOS) above this demand zone, showing:
A small, but significant shift in market sentiment.
Short-term trend change from bearish to bullish.
Fuel for the next leg up.
This BOS acts as confirmation that price is ready to move toward the target.
🎯 4. Targeting Major Resistance – $34.50 Zone
The ultimate goal is the Major Resistance Zone around $34.50. This zone has been tested before and caused strong rejections. But here’s the key difference now:
Price is approaching this level with momentum, structure, and buyer interest.
If MMC continues to play out, this zone could be taken out or at least retested for potential breakout continuation.
This area is marked as your Target Zone and is aligned with the mirrored projection.
🧠 5. What the Market Psychology Tells Us
Let’s not just read candles—let’s read the mind of the market:
Buyers are patiently absorbing every dip.
Sellers are losing control at each attempt to push price down.
The curve base structure is signaling accumulation.
Demand zones are holding perfectly.
Minor BOS adds more weight to bullish bias.
All these are classic MMC psychological footprints.
⚙️ Trade Plan (Educational Purpose Only):
🔹 Bullish Bias:
Entry: On confirmation above the minor BOS or demand retest.
Stop: Below the recent demand zone.
Target: $34.50 Major Resistance area.
🔹 Bearish Watch:
If price rejects from the curve or fails to hold above demand zone…
Price could revisit $32.50 or lower to re-test curve zone again.
📘 Final Thoughts:
This chart is a masterclass in how Mirror Market Concepts work. From the curve zone support to the demand hold, and now a clear target in sight, everything is lining up beautifully.
If you’re a price action trader, this is the kind of structure you wait weeks for.
If the bullish scenario plays out, we could see Silver make a strong run toward the $34.50 resistance zone in the coming days.
Keep your eyes on:
Curve zone support holding
Demand confirmation

Short-Term Key Levels for Silver as Price ContractsSilver has been contracting over the last couple of days. While the gold/silver ratio remains at historically high levels, ongoing risks in global trade and manufacturing provide strong justification for this imbalance.
In the short term, unless XAGUSD breaks above the 33.45 resistance, the direction may remain to the downside. The 200-hour moving average—often used as both support and resistance—can be followed as the next key short-term target. If this moving average is broken, bearish pressure could intensify.
For upward moves, a breakout above 33.45 could open the way toward 33.55 and 33.70 levels.

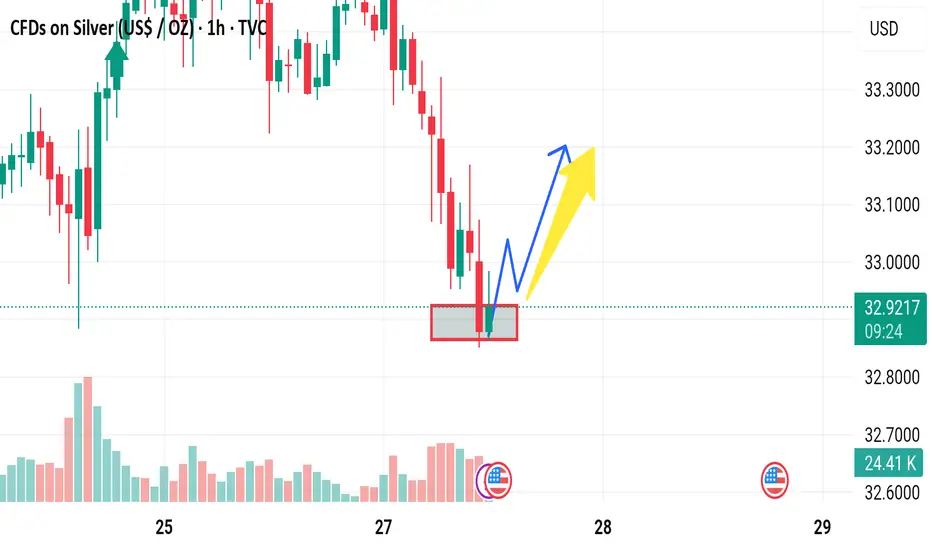
Market next move 🚨 Disruptive Take on the Current Silver-CFD Setup (1 h)
⚠️ Key Issue Why It Undermines the Long-Target Thesis
1. Target looks “wishful” The arrow projects a move into the 33.55–33.60 zone without price ever clearing the nearest resistance band around 33.30–33.35. A premature target can bait traders into chasing the tail end of a relief rally.
2. Volume doesn’t back the bounce Notice how the big green climb out of the pit on the 27 th started on strong volume, but the last 10–12 candles show shrinking green bars. Demand is decaying as price inches higher—a classic recipe for a bull trap.
3. Momentum is stalling The most recent candle printed red right at the dotted mid-line, hinting at exhaustion. Without a fresh momentum kick (e.g., higher high ➜ bullish engulfing), upside continuation is statistically fragile.
4. Structure still favors lower highs The broader pattern since the 25–26 th is a series of lower swing-highs. Until that diagonal is broken decisively, every uptick remains a counter-trend bounce, not a new up-trend.
5. Macro landmine ahead The U.S. flag icon marks an impending data release. Silver’s intraday volatility tends to spike on USD events; any dollar strength could instantly unwind the thin-volume rise. Trading into news with no contingency ≠ smart risk.
6. Stop-loss placement is unclear Without a clearly defined invalidation level (e.g., below 33.00 or under the 27 th swing-low), the R-R profile is lopsided: limited upside room vs. plenty of air underneath.

SILVER (XAGUSD) BUY TRADE PLANXAG/USD – Silver vs USD
Buy Entry: $33.25-35
📋 Plan Overview Table
Type Direction Confidence R:R Status
Swing Long 70% 2.7:1 Active Trade
📈 Market Bias & Type
Market Bias: Bullish to Neutral
Type: Continuation from breakout support
🔰 Confidence Level
Confidence: 70%
Breakdown:
Technical Structure: ✅ Bullish channel holding
Volume Pickup: ✅ Moderate confidence
Macro Sentiment: ⚠️ Mixed USD signals
Daily candle: ✅ Higher low formed
Overhead Resistance: ⚠️ Still present near $34.50
📍 Entry Zone
✅ EntRY at $33.25-35, which is within the recent demand bounce zone (between $33.10–$33.40)
❗ Stop Loss (Dynamic)
Primary SL: $32.60 (below recent swing low)
Alternative SL (tight): $32.90 (below previous candle low if managing tighter risk)
Reasoning: Clean invalidation below $32.60 would break the current bullish structure.
🎯 TP Targets
Take Profit Level Reason
TP1 $33.95 Mid-range resistance zone
TP2 $34.60 Previous top + psychological resistance
TP3 $35.30 March swing high zone
🧠 Management Strategy
Move to Breakeven at $33.70 (just before TP1)
Scale out 50% at TP1, trail stop for remainder
Tighten stop near $33.00 if candle closes bearish on H4
Watch DXY – USD strength could pause momentum
⚠️ Confirmation Checklist
✅ Price bounced from H4 demand
✅ Daily candle higher low
⚠️ Still under resistance at $34.00
✅ Volume showing re-engagement
✅ No bearish engulfing yet on D1
⏳ Validity
Plan Valid for 48–72 hours (Swing)
❌ Invalidation Conditions
Close below $32.60 on 4H or Daily timeframe
Break of bullish structure with strong volume sell-off
🌐 Fundamental & Sentiment Snapshot
USD: Mixed due to Fed ambiguity on rates
Silver Demand: Steady amid China stimulus & global inflation risks
COT Data: Funds still net long but slightly trimmed positions
Risk Sentiment: Gold + Silver recovering alongside equities
📋 Final Trade Summary
We have a solid long at $33.35. Hold with SL at $32.60.
First resistance at $33.95. If price breaks above that zone, $34.60–$35.30 remains on the table. Consider trailing your stop after TP1 and letting partials run.
Market next move
1. Misleading Bullish Label
Issue: The chart marks the latest price action as "Bullish" based on a short-term recovery.
Disruption: This could be a dead-cat bounce — a temporary recovery in a downtrend. The overall trend from the prior candles is bearish, and a few green candles don’t confirm a reversal without volume or structural confirmation.
---
2. Volume Analysis Ignored
Issue: The volume spike accompanying the recent green candles is not fully analyzed.
Disruption: Although there's higher volume, it could be short covering or a reaction to news, not organic buying interest. No volume divergence or institutional footprint confirmation is given.
---
3. No Confirmation Pattern
Issue: No mention of chart patterns (e.g., double bottom, inverse head and shoulders, etc.).
Disruption: Calling it “bullish” without a clear technical pattern or confirmation (like a break of resistance or retest) is speculative.
---
4. Vague Target
Issue: The “Target” is labeled without specifics.
Disruption: There's no price level, Fibonacci retracement, or resistance level justification. A target without rationale lacks credibility.
---
5. No Risk Management
Issue: No stop-loss or risk level is discussed.
Disruption: Without defined risk-reward ratio, the analysis is incomplete and not tradable. Every strategy needs downside planning.

SILVER: Target Is Down! Short!
My dear friends,
Today we will analyse SILVER together☺️
The price is near a wide key level
and the pair is approaching a significant decision level of 33.092 Therefore, a strong bearish reaction here could determine the next move down.We will watch for a confirmation candle, and then target the next key level of 32.856.Recommend Stop-loss is beyond the current level.
❤️Sending you lots of Love and Hugs❤️

SILVER SHORT FROM RESISTANCE
SILVER SIGNAL
Trade Direction: short
Entry Level: 3,288.2
Target Level: 3,157.4
Stop Loss: 3,374.6
RISK PROFILE
Risk level: medium
Suggested risk: 1%
Timeframe: 12h
Disclosure: I am part of Trade Nation's Influencer program and receive a monthly fee for using their TradingView charts in my analysis.
✅LIKE AND COMMENT MY IDEAS✅

Silver (XAG/USD) | MMC Retest in Play – Eyes on $33.55 TargetThis 1-hour chart of Silver (XAG/USD) presents a clean and compelling bullish setup, applying Mirror Market Concepts (MMC) in combination with classical price action, support/resistance flips, and trendline analysis. It outlines a likely bullish continuation scenario based on how price respects key structural levels.
🧩 1. Mirror Market Concepts (MMC) Overview
MMC views the market as a symmetrical organism, where past price behavior on one side of a pattern tends to be “mirrored” on the other side. Here, we see the market reflecting previous structural behaviors through:
Symmetrical lows and highs
Balanced corrective structures
Repeatable retests of trendline support
This creates a roadmap for anticipating price reactions, especially around previously respected levels.
🔸 2. Trendline Support – Anchoring Bullish Momentum
The rising trendline is a major structural feature. It's been respected three times previously (highlighted with blue circles), providing strong bullish support.
Current price is once again approaching this trendline.
A bounce here would confirm continued higher-low structure.
If trendline is broken, it may invalidate the bullish setup — so this acts as the key decision point.
🔸 3. SR Interchange Zone (Support/Resistance Flip)
The chart marks a wide SR Interchange Zone, previously resistance, now turned into support. This flip is a critical area for accumulation and re-entry by institutional players.
Price bounced from this zone earlier.
The current structure suggests price may retest this zone again during a potential fakeout or liquidity grab.
This level is a magnet zone for stop-hunting before continuation.
🔸 4. “Type of Retesting” – MMC Style
This chart specifically labels a "Type of Retesting", which refers to a deeper liquidity sweep where:
Price breaks minor support to tap trendline or SR zone liquidity.
Then reclaims the structure and resumes the uptrend.
This is a mirror market behavior — where past retests serve as a template for future ones. Expectation is for the same type of bounce from the trendline/SR area as seen before.
🔸 5. Projected Path – Bullish Scenario
The expected flow includes:
Price dips back into the trendline + SR Interchange confluence.
Forms a higher low (marked with arrows).
Breaks minor resistance levels toward Major Resistance at $33.556.
This zone acts as the target — derived from the previous swing high and structural mirror projection.
The target zone aligns with a key Fibonacci and historical resistance level — giving extra weight to this forecast.
🔸 6. Volume and Confirmation (Trader Tip)
While volume is not shown on this chart, experienced traders would:
Watch for volume divergence or spikes near the SR zone.
Seek candle confirmation (like bullish engulfing, pin bars, or strong wicks) near the trendline/SR confluence before entering.
🎯 Trading Plan Summary:
Entry Zone: Near trendline + SR Interchange support zone.
Stop Loss: Below the SR zone or swing low.
First Target: Return to $33.20–33.30 range.
Main Target: $33.556 (marked target zone on chart).
Invalidation: Strong break and close below trendline + SR zone, with no bounce.
📘 Educational Notes (For Traders):
Trendline retests are best traded in confluence with horizontal levels.
SR flips provide high-confidence zones for reaction.
MMC adds a predictive edge by recognizing repeating behavior and structure across mirrored segments of the chart.
This setup rewards patience, especially during consolidation near major support.
⚠️ Risk Management Reminder:
Always manage risk properly. Even with high-probability setups like this, price may wick below or fake out. Wait for confirmation. Avoid over-leveraging or premature entries.

Market next move
1. False Breakout / Bull Trap Risk
Observation: Price just touched the support and bounced slightly.
Disruption: If buyers fail to push above the next resistance (around 32.95–33.00), it could be a bull trap.
Implication: The bounce might just be a short-covering rally before another leg down.
---
2. Weak Buying Volume
Observation: The bounce lacks strong green volume bars so far.
Disruption: Weak volume on the bounce suggests limited buyer conviction.
Implication: Without a volume surge, the upward move could fizzle out quickly.
---
3. Lower High Structure
Observation: The trend before the support touch is clearly down.
Disruption: This bounce may only form a lower high before continuation lower.
Implication: The larger trend remains bearish unless 33.20+ is reclaimed with strength.
---
4. Fundamental Headwinds
Disruption: Any upcoming data like strong USD, rising interest rates, or weak industrial demand could push silver down despite technical setups.
Implication: Bullish setups could fail fast due to macroeconomic pressure.
SILVER Buyers In Panic! SELL!
My dear friends,
Please, find my technical outlook for SILVER below:
The price is coiling around a solid key level - 33.484
Bias - Bearish
Technical Indicators: Pivot Points Low anticipates a potential price reversal.
Super trend shows a clear sell, giving a perfect indicators' convergence.
Goal - 32.948
Safe Stop Loss - 33.744
About Used Indicators:
The pivot point itself is simply the average of the high, low and closing prices from the previous trading day.
Disclosure: I am part of Trade Nation's Influencer program and receive a monthly fee for using their TradingView charts in my analysis.
———————————
WISH YOU ALL LUCK
