XAG/USD – 4H Elliott Wave AnalysisFXOPEN:XAGUSD
Silver is currently in the final stages of a higher-degree Wave 3, which itself is unfolding in a classic 1-2-3-4-5 structure. Within this larger move, we are completing Wave C, which again consists of five subwaves – and that’s where we are right now: transitioning from Wave 4 into Wave 5.
🔍 On this move, we can identify a clear ABC structure — or rather, a cluster of smaller ABC setups — within the Wave 4 to Wave 5 leg.
⚪️ The white Wave A has already completed.
🌀 We are now on the way to the white Wave B.
💠 The expected ABC move from A to B is marked in turquoise on my chart.
📈 From B, I’m expecting a clean 1-2-3-4-5 impulsive rally into the higher-degree target zones of Wave 3.
🚨 If the turquoise Wave 5 fails to hold or shows early weakness, I’ve marked an alternate yellow A, signaling potential downward momentum. In that case, I’ll be watching closely for impulsive moves to the downside — giving us fresh short (sell) entry opportunities.
CFDs on Silver (US$ / OZ)
38.3890USDR
+1.3950+3.77%
At close at Jul 11, 22:11 GMT
USD
No trades
SILVER trade ideas


Silver Traces New Highs Last Seen in 2011As silver traces new 2025 records, surpassing 2012 highs above 37.50/ounce, it aligns further with the target of the inverted head and shoulders pattern that has extended on the chart between 2020 and 2024, within the 38–39 price zone.
This aligns with overbought momentum from the perspective of the monthly RSI, at levels last seen in 2020, strengthening the case for a potential pullback to recharge momentum—possibly back toward levels 35, or 32 and 29 in a steeper scenario.
Should the price trend hold above the 39-price zone, further gains can be forecasted toward 42, 46, and eventually the 50 high, in line with tech advancement.
- Razan Hilal, CMT


"XAG/USD: BULL FLAG FORMING? LAST CHANCE TO JUMP IN!"🔥 XAG/USD "SILVER RAID" – Bullish Loot Grab Before the Cops Arrive! 🚨💰
🌟 Greetings, Market Pirates & Profit Bandits! 🌟
Based on the 🚨Thief Trading Style🚨 (a ruthless mix of technicals + fundamentals), we’re plotting a day/swing trade heist on XAG/USD (Silver). Our mission? Loot bullish gains before hitting the police barricade (resistance zone). Stay sharp—this is a high-risk, high-reward escape plan with overbought signals and bearish traps lurking!
📜 THE HEIST BLUEPRINT
🎯 Entry (Bullish Swipe):
"Vault is OPEN!" – Long at any price, but for smarter thieves:
Buy limit orders near swing lows/highs (15m-30m TF).
DCA/Layering strategy: Spread entries like a pro bandit.
🛑 Stop Loss (Escape Route):
Nearest swing low/high (1H candle body/wick) → 36.700 (adjust based on risk & lot size).
Risk management is key! Don’t get caught by the market cops.
🏴☠️ Take Profit (Escape Before Handcuffs!):
First Target: 38.500 (or bail earlier if momentum fades).
Scalpers: Only play LONG! Use trailing SL to lock profits.
💡 WHY THIS HEIST? (Market Drivers)
Bullish momentum in Silver (XAG/USD) fueled by:
Macro trends (COT report, sentiment shifts).
Intermarket moves (Gold correlation, USD weakness).
Potential breakout from consolidation.
⚠️ News Risk: Major releases can trigger volatility—avoid new trades during high-impact events!
🚨 THIEF'S PRO TIPS
✅ Trailing SL = Your getaway car.
✅ Small accounts? Ride the swing traders’ coattails.
✅ Big wallets? Go full-throttle.
✅ Boost this idea 💥 to strengthen our robbery squad!
📌 DISCLAIMER (Stay Out of Jail!)
Not financial advice! DYOR, manage risk, and adapt to market changes.
Silver is volatile—trade smart, not greedy.
🤑 NEXT HEIST COMING SOON… STAY TUNED! 🕵️♂️
🔗 Want the Full Intel?
Check the fundamentals, COT reports, and intermarket analysis for deeper clues! (Klick the 🔗🔗).
💬 Drop a comment if you’re joining the heist! 👇


Silver Analysis – Potential Top in Place?FXOPEN:XAGUSD
We've now reached the Fibonacci Extension Take-Profit zone from our (4) to (5) move – which is actually part of the larger Wave 3 structure.
The move up unfolded in an ABC structure, which itself formed a smaller 1-2-3-4 (with the 4 again as an ABC).
🚀 So technically, we may have already topped out.
⚠️ What to Watch For:
There may still be some upside volatility, which is why I’m currently watching the yellow trendline closely.
📉 A clean break below it would signal that Wave (5) is likely done, and we’ve started our next move:
➡️ (1) → (2) → (3) → (4) → (5)
This would be the start of corrective Wave (A) of a larger ABC move.
📈 If the yellow trendline holds, we could still see higher highs – but based on current chart structure and momentum…
📊 Indicators are extremely overbought and flashing bearish divergence, supporting the idea that a local top is already in.

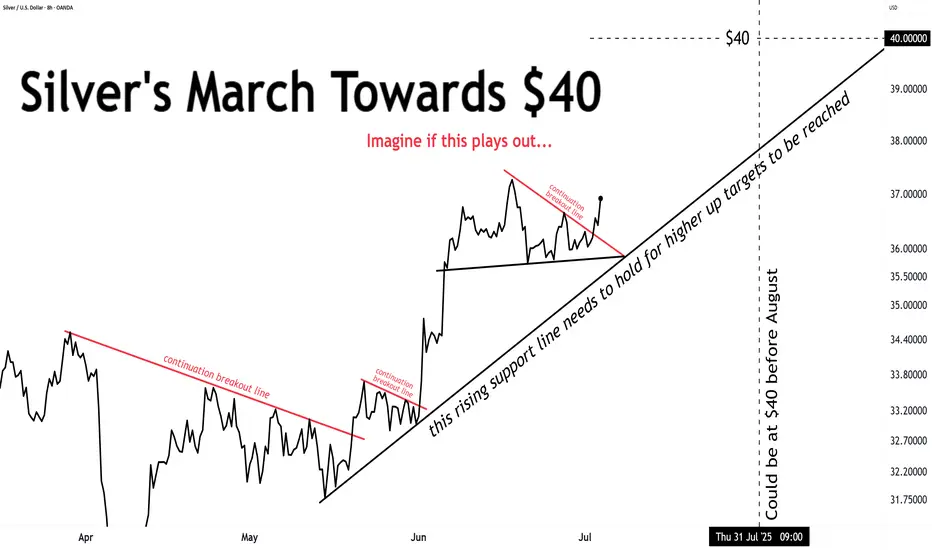
SILVER, BULLISH MACD and RSI CROSS!Once in 23 year opportunity to jump on the silver train before it leaves the station.
Every single time we have seen this MACD and RSI bullish cross, silver has outperformed the SPX by 400-500%+!
This is happening without a current bear market in equities, reflecting the inflationary environment.
Happy stacking!

Short term pullback is overFrom my last analysis on silver, we had a sell on silver, but it happened that the short term sell was liquidity the market used to buy dip.
Looking at the red rectangle we can see that silver has finished accumulating at that zone and is heading north ⬆️,so we are bullish going forward.
Target profit:38.00 , 39.00

Silver Shows Promising Growth – It’s Not Too Late to JoinSilver is showing a pretty solid upward movement. It’s a harmonious and steady growth. I believe we’re just at the beginning of the trend, so it’s not too late to buy even now.
If you don’t have a position yet, you can still take advantage of this opportunity.
Set your stop-loss just below today’s low — at 36.90.
SILVER: Short Signal with Entry/SL/TP
SILVER
- Classic bearish formation
- Our team expects fall
SUGGESTED TRADE:
Swing Trade
Sell SILVER
Entry Level - 38.415
Sl - 38.910
Tp - 37.378
Our Risk - 1%
Start protection of your profits from lower levels
Disclosure: I am part of Trade Nation's Influencer program and receive a monthly fee for using their TradingView charts in my analysis.
❤️ Please, support our work with like & comment! ❤️


XAG/USD elliot wave countFXOPEN:XAGUSD
📊 Silver – Elliott Wave Analysis (Overview)
🔹 Macro Structure:
We’ve already completed the larger Wave 3 and are now transitioning into Wave 4.
🔹 Corrective Structure – Wave 4:
The A wave of the correction is already completed.
The B wave has also been completed.
We are now in the process of building the C wave, which will complete Wave 4.
🔹 Internal Structure of Wave C:
From the end of Wave B, we’ve already formed a (1) and (2) (in brackets).
Within this move, another smaller (1) and (2) have now unfolded, and we are currently on the way to the (3) of C.
🔹 Market Context:
Target zones and entry zones are already marked on the chart.
These zones can still be adjusted, depending on how price action develops in the coming days.

XAG/USD Daily AnalysisPrice is moving within a bullish channel, which is itself situated inside a bigger bullish structure.
The most recent price action appears to be a consolidation within the uptrend.
Price may possibly be setting up for another impulsive move towards the top of structure for a 3rd test.
If you agree with this analysis, look for a trade that meets your strategy rules.

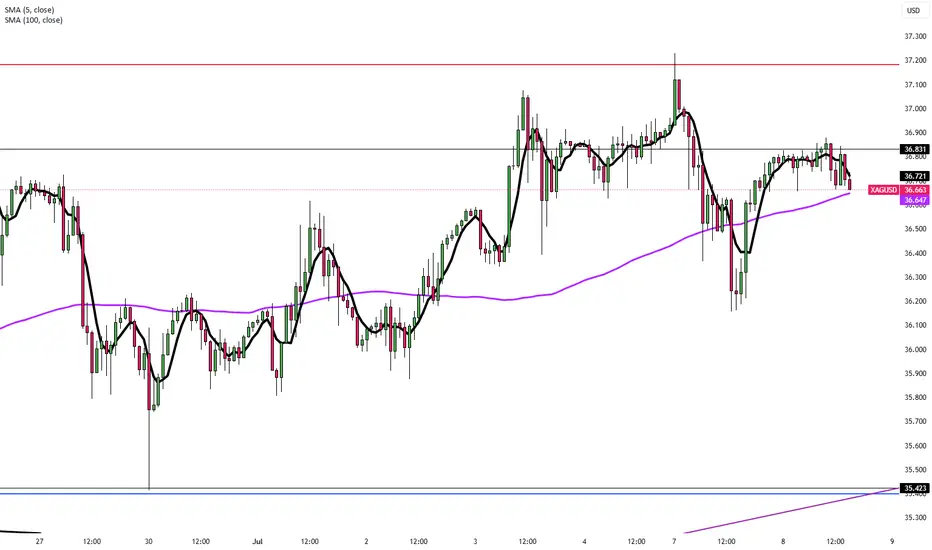
SILVER: Local Bearish Bias! Short!
My dear friends,
Today we will analyse SILVER together☺️
The price is near a wide key level
and the pair is approaching a significant decision level of 36.435 Therefore, a strong bearish reaction here could determine the next move down.We will watch for a confirmation candle, and then target the next key level of 36.336..Recommend Stop-loss is beyond the current level.
❤️Sending you lots of Love and Hugs❤️

SILVER: Bulls Are Winning! Long!
My dear friends,
Today we will analyse SILVER together☺️
The price is near a wide key level
and the pair is approaching a significant decision level of 36.433 Therefore, a strong bullish reaction here could determine the next move up.We will watch for a confirmation candle, and then target the next key level of 36.547.Recommend Stop-loss is beyond the current level.
❤️Sending you lots of Love and Hugs❤️
Silver Holds Near $36.80 on Tariff FearsSilver remains steady just below $37.00, hovering around $36.80 in Tuesday’s Asian session after a sharp rebound from the $36.15 level seen late Monday. The metal continues to trade in a tight range as conflicting market signals keep traders cautious.
Global trade tensions and geopolitical uncertainties, fueled by the U.S.’s upcoming tariffs on multiple countries and its hardline stance against BRICS-aligned nations, have elevated market risk perception. This has sparked a modest uptick in safe-haven demand, offering limited support to silver.
The strength of the U.S. Dollar and uncertainty surrounding future interest rate decisions are capping silver’s upside potential. Market participants remain focused on incoming economic data and central bank signals for clearer direction.
In the near term, silver is expected to stay volatile and highly reactive to geopolitical and economic headlines.
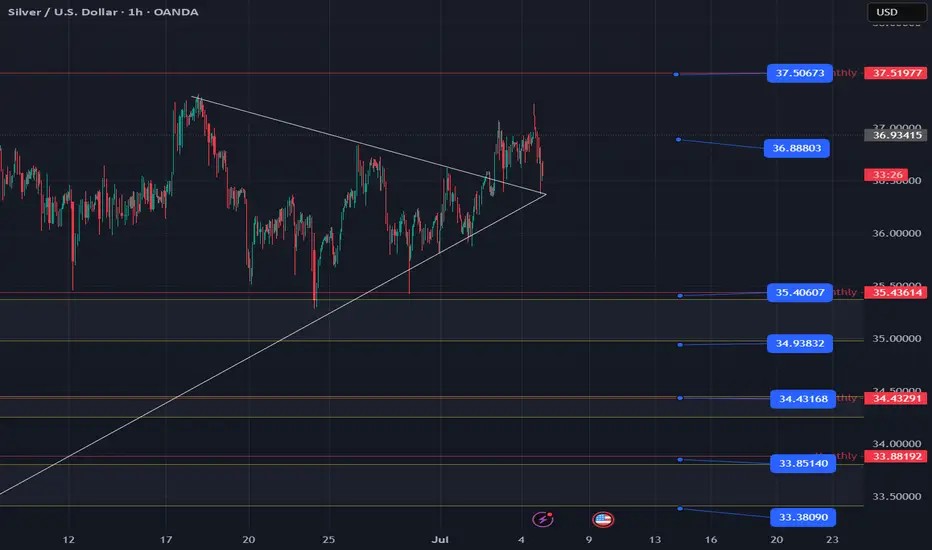
Resistance is at 37.50, while support holds at 35.40.

Silver (XAGUSD) Structural Analysis : Curve break & TargetSilver is exhibiting a textbook bullish continuation pattern, guided by a parabolic curve structure that reflects intensifying buyer momentum. This unique setup provides a high-probability trading roadmap as we approach a major reversal zone—one where smart money may look to offload long positions or enter fresh shorts.
This analysis aims to help traders anticipate the likely path of XAGUSD based on structure, liquidity behavior, and trend psychology.
🔍 Key Structural Observations:
1. Black Mind Curve Support (Dynamic Bullish Structure)
This parabolic arc acts as dynamic support. Every bounce from the curve shows growing strength in buyer conviction.
The price is riding the curve upward with higher lows, signaling accumulation with momentum.
This is not a standard trendline but rather a curve reflecting the accelerated nature of this uptrend.
2. Aggressive Bullish Momentum
The recent price behavior has shown strong impulsive candles to the upside followed by shallow corrections, confirming bullish dominance.
Volume and candle size increase near the curve, suggesting institutional interest.
3. Reversal Zone: 37.20 – 37.45
Marked as the Next Reversal Zone, this green box represents a key supply area where previous swing highs exist.
Historically, price struggled to break this region cleanly, making it a high-probability reaction zone.
Expect either:
a bearish rejection (short-term correction), or
a consolidation before a breakout continuation.
4. Liquidity Pool & Needed Volume Zone (~35.20 – 35.50)
The market often revisits zones of untapped liquidity. This area likely holds:
Buy-side stop losses
Unfilled institutional orders
If the market needs a deeper retracement, this is the zone to watch for re-accumulation.
🧠 Market Psychology Behind This Setup:
This structure suggests a classic case of smart money accumulation, with price moving upward in a controlled yet aggressive fashion. The parabolic nature of the move points to:
Increasing retail buy-ins
FOMO-driven entries
Possible engineered sweep before the next impulse
The reversal zone could become a profit-taking area for institutions. If large players want to continue higher, they may first induce a pullback to absorb more volume at lower prices (near the curve or liquidity zone).
🔧 Tactical Playbook for Traders:
For Bulls (Long Bias):
Watch for pullbacks toward the curve or liquidity zone.
Enter long positions on bullish confirmation (e.g., engulfing candles, pin bars) off those zones.
Targets: 37.20 – 37.45, possibly higher if broken with strength.
For Bears (Countertrend Traders):
Wait for clear rejection patterns in the reversal zone.
Use confirmation like RSI divergence, momentum slowdown, or distribution volume.
Target: Curve support or deeper liquidity zone for reentry.
📌 Key Technical Levels:
Zone Price Range Description
Reversal Zone 37.20 – 37.45 Resistance / Take-Profit Area
Curve Support Dynamic (rising) Support based on parabolic arc
Liquidity Pool 35.20 – 35.50 High-volume demand zone
🧭 Conclusion
Silver is currently in a momentum-driven phase supported by smart money activity. The parabolic structure and clean liquidity map give traders a clear plan to engage both long and short setups with timing and precision. Patience around the reversal zone will be key, as the next major move may depend on how price behaves in this critical area.

Long Silver A possibility of a slight pull back is expected. Before moving higher. The pull back is expected to be for a short period maybe 1-2 days of consolidation before going up higher to the predicted region.
My course will be coming up soon. Stay tune.
As always stay cautious and always do your own due diligence. Trading requires good risk management. Stay safe.

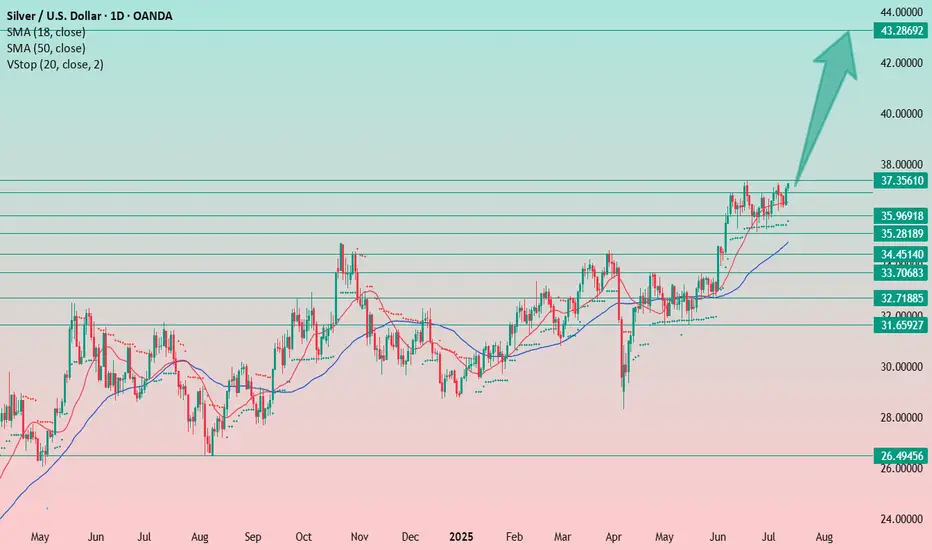
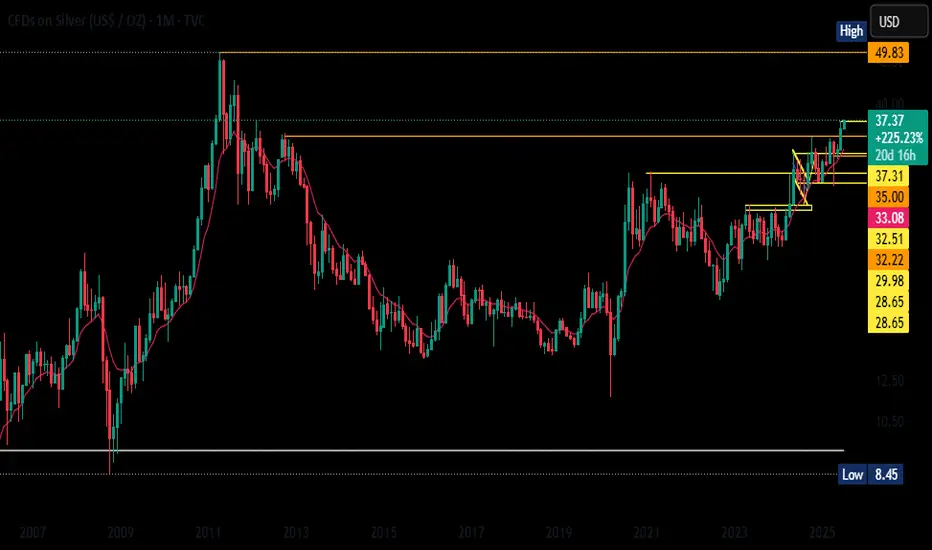
Final call before take offLook at the monthly chart of Silver (CFDs in USD/OZ), the longterm trend is clearly bullish. After spending over a decade consolidating below the $30–35 zone, The breakout above this historical resistance is significant and shows strong momentum, especially with price holding well above the 10-month EMA. We’re currently testing the $37.31 level, and if that gets taken out cleanly, the next major target is the all-time high at $49.83 from 2011. The recent structure even resembles a cup-and-handle or ascending triangle pattern, adding more weight to the bullish case. Support zones are now layered at $35, $33.06, and $32.51—key levels that were previous resistances. If there's any dip back to those zones, it may offer a solid buy-on-dips opportunity. As long as Silver holds above $35 on the monthly chart, I stay bullish with eyes on a move toward the $49.83 zone.
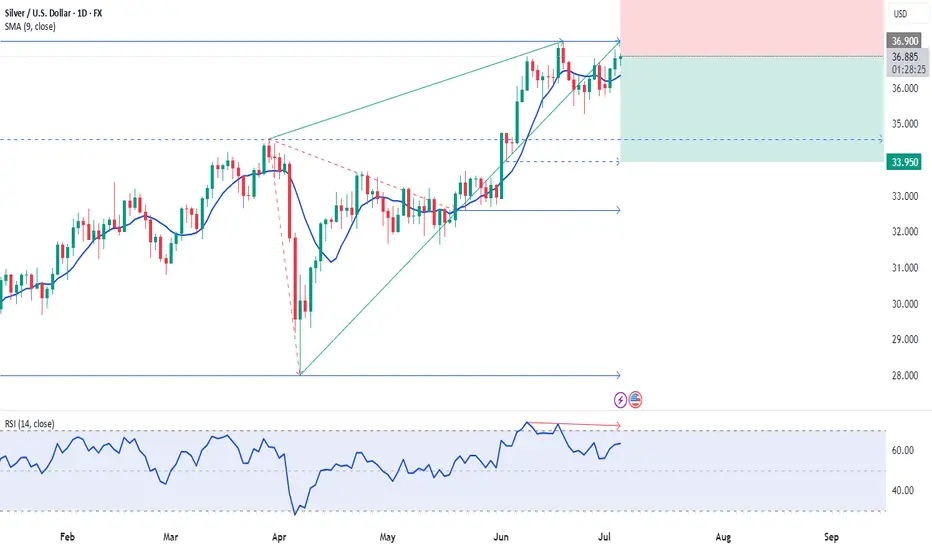
04.07.2025 #XAGUSDSELL 36.9000 | STOP 38.5000 | TAKE 34.7000 - 33.9500 | Medium-term investment forecast on silver deal for the next 2-3 months. On the D1 chart we observe the technical structure of the completion of the ascending wedge. Formation of double top of highs. We also consider a probable potential for the output of volumes in this instrument and a gradual decline to a pronounced support range on the background of growing interest and the potential of the US dollar until the end of summer.