SILVER: The Market Is Looking Up! Long!
My dear friends,
Today we will analyse SILVER together☺️
The price is near a wide key level
and the pair is approaching a significant decision level of 36.830 Therefore, a strong bullish reaction here could determine the next move up.We will watch for a confirmation candle, and then target the next key level 36.903.Recommend Stop-loss is beyond the current level.
❤️Sending you lots of Love and Hugs❤️
CFDs on Silver (US$ / OZ)
38.4562USDR
+0.0672+0.18%
As of today at 22:43 GMT
USD
No trades
SILVER trade ideas

XAGUSD Analysis : Consolidation & FMFR Setup + Target🧭 Technical Overview:
Silver has had a strong bullish rally that started after the breakout of a long-term symmetrical triangle pattern. This breakout marked a Major Break of Structure (BOS) and shifted the overall market sentiment toward the bulls. Since then, price has been consolidating under a major resistance zone, forming a compression range, which is now shown as a blue elliptical zone in the chart.
This ellipse is not just a consolidation area — it represents a neutral compression zone where price can explode in either direction. The price action inside this area has been choppy and manipulative, sweeping both local highs and lows without real follow-through — a perfect environment for a Fake Move – then Reversal (FMFR) strategy.
🔍 Key Chart Components:
🔹 1. Ellipse (Dual Directional Zone)
This region shows indecision. Price is coiling inside, creating higher lows and lower highs — a volatility squeeze. A breakout from this ellipse is likely, but the first breakout move may be fake, followed by a quick reversal.
🔹 2. Major BOS (Break of Structure)
Price broke out of a long-term descending structure and pushed strongly upward, which marked a significant bullish shift. The pullback after that BOS was shallow — a sign of continued strength — but now we’re at a decision point.
🔹 3. Resistance Zone (Previous Target Area)
The price is now retesting a strong historical resistance around $37.00–$38.00, where we’ve seen rejections before. This is the liquidity zone where breakout traders enter long, but institutions may sweep them for liquidity before reversing.
🔹 4. Minor and Major CHoCH Levels
Minor CHoCH: Around $35.00–$35.50
Major CHoCH: Near $33.80–$34.00
These are reversal zones to watch if a fake move to the upside occurs and price rolls over.
📉 FMFR Setup Explained:
FMFR (First Move Fake Reversal) is a market behavior pattern where:
Price fakes a breakout in one direction (e.g., above resistance).
Attracts liquidity (traders’ orders).
Reverses rapidly in the opposite direction, trapping those who entered late.
In your chart, the blue notes say:
“In This Case, XAGUSD Have to Gave FMFR From Anyside”
“First Move Fake Then Reversal”
This highlights that no matter which direction the market initially breaks, it’s likely to reverse shortly afterward. This pattern is often seen before major moves when the market seeks to clear liquidity.
🔄 Scenarios to Watch:
🅰️ Bull Trap (Fake Breakout)
Price spikes above $37.80–$38.00.
Sweeps the highs and rejects sharply.
Reversal triggers below the ellipse, heading toward minor/major CHoCH.
🅱️ Bear Trap (Fake Breakdown)
Price dips below $35.00 (minor CHoCH).
Triggers panic sells.
Then rebounds quickly into the previous high zone or beyond.
⚙️ Trading Strategy Ideas:
Wait for Confirmation: Enter only after a confirmed breakout and retest OR a fakeout with reversal candles (e.g., engulfing, pin bar).
Use Tight Risk Management: Place stops outside sweep zones. This setup is volatile and can trap undisciplined trades.
Watch Volume & Wicks: Spikes with wicks and no close beyond the level usually confirm FMFR setups.
🔐 Key Levels to Watch:
Zone Price Level Action
Major Resistance $37.00–$38.00 Watch for fakeouts
Minor CHoCH ~$35.00–$35.50 Reversal entry zone
Major CHoCH ~$33.80 Last line of bullish defense
📝 Final Thoughts:
This is a textbook FMFR compression setup, where volatility is building inside a symmetrical price zone. The first aggressive move from this region is likely to be deceptive. Smart money traders look for trap setups, not the obvious direction. Silver is approaching a high-risk, high-reward decision zone, and staying patient will be key.
📊 Wait. Observe. React — don’t predict blindly.

Bull flag forming on silver at 14-year highsSilver has broken above a resistance level that goes all the way back to the fall of 2011. Its been forming this bull flag above, looking super bullish. I'm still waiting for it to come down into the top of the previous level of resistance and test it as support, which would be between $34.50 and $35. After testing as support, look for silver to go on to challenge the all-time highs. There is no guarantee that silver will come down into the support level.

SILVER Short From Resistance! Sell!
Hello,Traders!
SILVER is trading in an
Uptrend but the price will
Soon hit a horizontal resistance
Area around 37,32$ from
Where we will be expecting
A local bearish correction
Sell!
Comment and subscribe to help us grow!
Check out other forecasts below too!
Disclosure: I am part of Trade Nation's Influencer program and receive a monthly fee for using their TradingView charts in my analysis.


“Can This XAG/USD Setup Make You the Next Market Thief?”🏴☠️ Operation Silver Swipe — Thief Trading Heist Plan for XAG/USD 🪙💸
🚨 Target Locked: The Silver Vault 🧳🎯
🌟Hi! Hola! Ola! Bonjour! Hallo! Marhaba!🌟
Dear Market Hustlers & Chart Whisperers, 🕵️♂️💼📉💰
Step into the shadows with our stealth plan based on our signature Thief Trading Style—a mix of smart technicals and crafty fundamentals. Today, we’re eyeing XAG/USD (Silver) for a clean sweep. Here's how to gear up for the breakout job:
🎯 Entry Zone — “The Heist Is On!” 💥
📍Key Level: Break & Retest above 36.500 – that's your cue to act.
🔑Strategy:
Buy Stop Orders: Set above the breakout level
Buy Limit Orders: Use recent 15/30M swings for a sneaky pullback entry 🎯
🛑 Stop Loss — “Every Thief Has a Backup Plan” 🎭
Place your SL like a pro, not a panic button!
📌Recommended: Around 31.700 using the 4H swing low
⚠️Tip: Adjust based on your risk appetite, lot size, and number of entries. You’re the mastermind, not a minion.
🎯 Target — “Escape Route” 🏃♂️💸
📌 First checkpoint: 37.700
📌 Or take your loot early if the heat rises! (Overbought zones, trend traps, or reversal zones)
💡 Scalper's Shortcut 💡
Go only long for safety. If you’ve got the cash stack, jump in fast. If you’re more of a sneaky swing trader, follow the roadmap and trail your SL to secure that bag 🧳📈
🔍 Market Status
Silver’s in a Neutral Phase – but signs point to an upward getaway 🚀
Fueling this momentum:
Macro & Fundamental trends
COT Positioning
Intermarket Clues
Sentimental Signals
🔗 Read the full breakdown check there 👉🔗🔗🌏🌎!
📢 Trading Alert — News Release Caution ⚠️
Don’t get caught mid-escape during news bombs! 💣
✅ Avoid fresh entries during high-impact events
✅ Use trailing SL to lock in your gains and cover your tracks
💖 Smash the Boost Button if you vibe with this plan 💥
Support the crew and help keep the charts hot and the loot flowing. Your boost powers up our next big heist 🚁🔥
📡 Stay tuned for more street-smart setups... we rob the charts, not the rules! 🐱👤💸📊💎


SILVER US$ 1H CHART PATTERNSilver (XAG/USD) 1H timeframe, here’s a breakdown of the target levels indicated:
📈 Chart Analysis Highlights:
The chart shows a bullish ascending triangle pattern, which is typically a continuation pattern signaling upward movement.
The price has recently broken above resistance around the 36.36–36.40 area.
You’ve marked two target points:
---
🎯 Target Levels:
1. First Target Point:
Price Level: Approximately 37.40 USD
This is the first significant resistance level after breakout, potentially reachable if momentum continues.
2. Second Target Point (Extended Target):
Price Level: Approximately 37.80 USD
This would be a more ambitious target assuming strong bullish follow-through.
---
📌 Notes:
Ensure to monitor volume on breakout for confirmation.
Risk management is important — consider stop-loss near 36.10 or below the ascending trendline.
Watch for any false breakouts especially near Ichimoku cloud resistance zones.
Would you like help setting up entry/exit levels or risk-reward ratios?

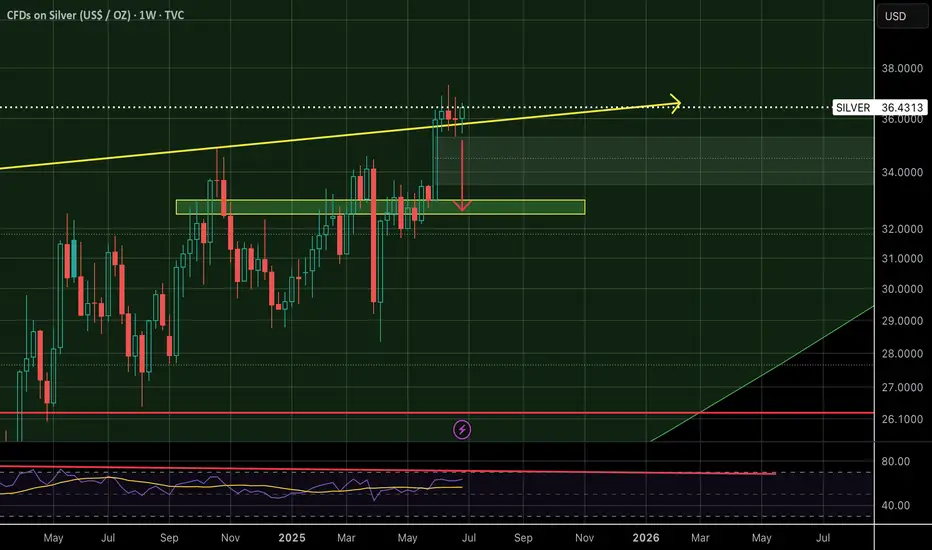
Silver Analysis – June 29, 2025Over the past two weeks, silver surged to the $37 level, forming a new high.
Given the speed of this move from the $33 area, this nearly 20% rally appears a bit too sharp in a short time frame.
💡 As a result, profit-taking around $37 is likely, making it harder for silver to break above this level in the near term.
We expect a period of consolidation or a minor pullback, potentially dragging the price back toward the $33 zone — where buy orders may start getting triggered.
📌 The $33 area could offer a more attractive buying opportunity.
Whether silver can retest the previous highs will largely depend on the strength and volume of demand at that level.


Silver Extends Gains to $36.70Silver hovered near $36.70 on Thursday after rising 1.4% in the previous session, supported by easing trade tensions and stronger expectations of Fed rate cuts.
Markets are now watching key US economic releases to see whether silver can sustain its upward momentum.
Resistance is at 37.50, while support holds at 35.40.

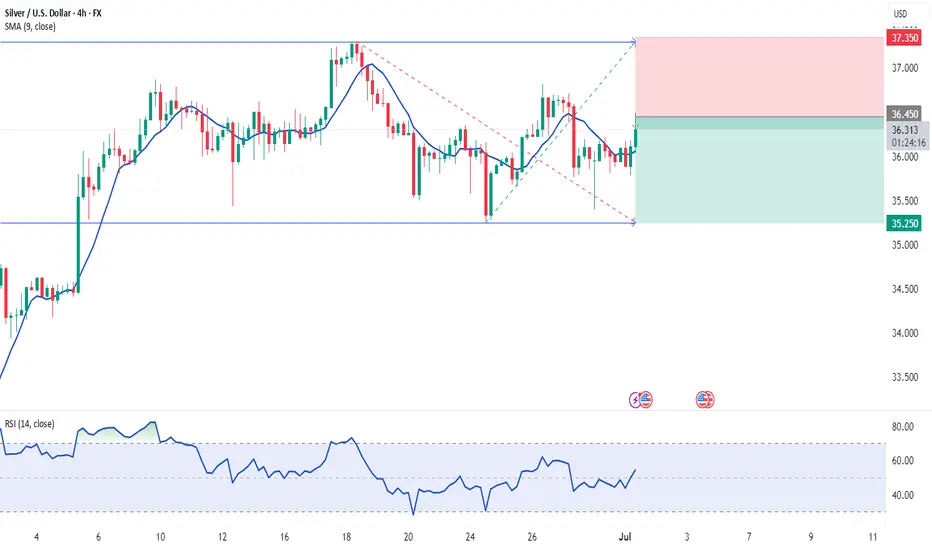
SILVER (XAGUSD): Pullback From SupportIt seems that the time has come for 📈SILVER to experience a pullback.
This morning, I've observed a solid intraday bullish signal with the emergence of a head and shoulders pattern on the 4-hour chart.
I anticipate a pullback to at least 36.61, followed by a move to 36.95.

Silver (XAG/USD) on the 1-hour timeframe.Silver (XAG/USD) on the 1-hour timeframe, the chart shows a bullish breakout from a symmetrical triangle pattern. Here's the target breakdown:
📈 Silver Bullish Targets:
Current Price: Around 36.42
1st Target (TP1): Approximately 36.95 – 37.00
2nd Target (TP2): Approximately 37.40 – 37.50
These targets are based on the breakout from the triangle and previous resistance zones marked on your chart.
🛑 Suggested Support Zone (Breakout Retest Area):
Around 36.00 – 36.20 (acts as support now after the breakout)
If price holds above this zone, the bullish structure remains valid. Let me know if you'd like stop loss suggestions or lower timeframe analysis.

SILVER: Will Go Up! Long!
My dear friends,
Today we will analyse SILVER together☺️
The price is near a wide key level
and the pair is approaching a significant decision level of 36.440 Therefore, a strong bullish reaction here could determine the next move up.We will watch for a confirmation candle, and then target the next key level of 36.607.Recommend Stop-loss is beyond the current level.
❤️Sending you lots of Love and Hugs❤️

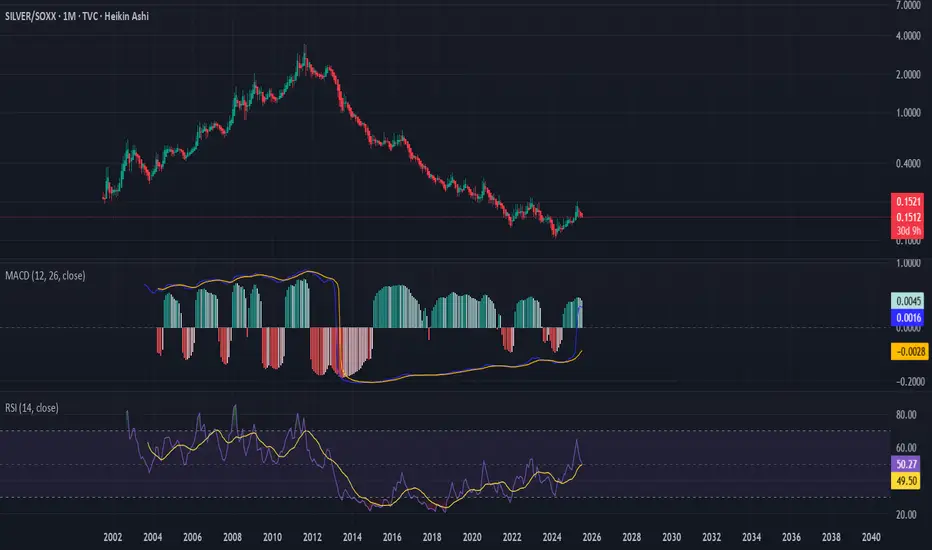
Rotation from over valued equities in silver about to happen...I hear many people are selling their silver, thinking $36 is a high. But this is still the stealth accumulation phase. We will see a rotation of trillions into silver, that has a market cap of a few hundred billion, including miners.
In my book, "Silver is Money" we see stocks, bonds and government debt has kept a lid on inflation.
This coming rotation will bring about the biggest monetary change seen in generations.

Possible Movement of Silver: Watch the Golden Zone RetestSilver has broken above a two-top downtrend with a strong bullish impulse, marked by a long white candle. Currently, it appears to be forming a Head and Shoulders pattern. A break below the neckline and the supporting uptrend could lead price back to the golden zone—around the base of the breakout candle—before resuming its upward move toward the main target near $39.

SILVER: Move Down Expected! Short!
My dear friends,
Today we will analyse SILVER together☺️
The in-trend continuation seems likely as the current long-term trend appears to be strong, and price is holding below a key level of 36.310 So a bearish continuation seems plausible, targeting the next low. We should enter on confirmation, and place a stop-loss beyond the recent swing level.
❤️Sending you lots of Love and Hugs❤️

Silver sideways consolidation support at 3500Silver – Technical Analysis
The Silver price action continues to exhibit a bullish sentiment, underpinned by a prevailing rising trend. However, recent intraday moves indicate a corrective pullback, reflecting short-term consolidation within the broader uptrend.
Key Technical Levels:
Support:
3,500 – Primary support and previous consolidation zone; critical for maintaining bullish structure.
3,450 – Secondary support; potential downside target if 3,500 fails.
3,390 – Key lower support; aligns with a broader demand area.
Resistance:
3,720 – Immediate upside resistance; first target on a bullish bounce.
3,790 – Intermediate resistance; aligns with recent swing highs.
3,850 – Long-term resistance target; marks the upper boundary of the current bullish channel.
Scenario Analysis:
Bullish Continuation (Base Case):
A bounce from the 3,500 level would affirm the corrective pullback as temporary, with potential for a bullish continuation targeting 3,720, followed by 3,790 and 3,850 over a longer timeframe.
Bearish Reversal (Alternative Scenario):
A daily close below 3,500 would undermine the current bullish outlook and signal a deeper retracement, with downside risk toward 3,450 and potentially 3,390, where structural support may stabilize price.
Conclusion:
Silver remains structurally bullish, with the current pullback offering a potential entry point within the trend. The 3,500 level is the key pivot—holding above it supports further upside continuation, while a breakdown below would raise the risk of a deeper correction. Traders should watch for price action confirmation at this level to validate the next directional move.
This communication is for informational purposes only and should not be viewed as any form of recommendation as to a particular course of action or as investment advice. It is not intended as an offer or solicitation for the purchase or sale of any financial instrument or as an official confirmation of any transaction. Opinions, estimates and assumptions expressed herein are made as of the date of this communication and are subject to change without notice. This communication has been prepared based upon information, including market prices, data and other information, believed to be reliable; however, Trade Nation does not warrant its completeness or accuracy. All market prices and market data contained in or attached to this communication are indicative and subject to change without notice.

SILVER BEARS ARE STRONG HERE|SHORT
SILVER SIGNAL
Trade Direction: short
Entry Level: 3,607.1
Target Level: 3,250.7
Stop Loss: 3,843.0
RISK PROFILE
Risk level: medium
Suggested risk: 1%
Timeframe: 1D
Disclosure: I am part of Trade Nation's Influencer program and receive a monthly fee for using their TradingView charts in my analysis.
✅LIKE AND COMMENT MY IDEAS✅
