SILVER: Move Down Expected! Short!
My dear friends,
Today we will analyse SILVER together☺️
The in-trend continuation seems likely as the current long-term trend appears to be strong, and price is holding below a key level of 36.310 So a bearish continuation seems plausible, targeting the next low. We should enter on confirmation, and place a stop-loss beyond the recent swing level.
❤️Sending you lots of Love and Hugs❤️
CFDs on Silver (US$ / OZ)
38.1606USDR
−0.2284−0.59%
As of today at 20:40 GMT
USD
No trades
SILVER trade ideas

Bearish drop off pullback resistance?XAG/USD is rising towards the resistance level which is a pullback resistance and could drop from this level to our take proft.
Entry: 36.70
Why we like it:
There is a pullback resitance.
Stop loss: 37.24
Why we like it:
There is a pullback resistance level.
Take profit: 34.78
Why we like it:
There is a pullback support level that lines up with the 127.2% Fibonacci extension.
Enjoying your TradingView experience? Review us!
Please be advised that the information presented on TradingView is provided to Vantage (‘Vantage Global Limited’, ‘we’) by a third-party provider (‘Everest Fortune Group’). Please be reminded that you are solely responsible for the trading decisions on your account. There is a very high degree of risk involved in trading. Any information and/or content is intended entirely for research, educational and informational purposes only and does not constitute investment or consultation advice or investment strategy. The information is not tailored to the investment needs of any specific person and therefore does not involve a consideration of any of the investment objectives, financial situation or needs of any viewer that may receive it. Kindly also note that past performance is not a reliable indicator of future results. Actual results may differ materially from those anticipated in forward-looking or past performance statements. We assume no liability as to the accuracy or completeness of any of the information and/or content provided herein and the Company cannot be held responsible for any omission, mistake nor for any loss or damage including without limitation to any loss of profit which may arise from reliance on any information supplied by Everest Fortune Group.

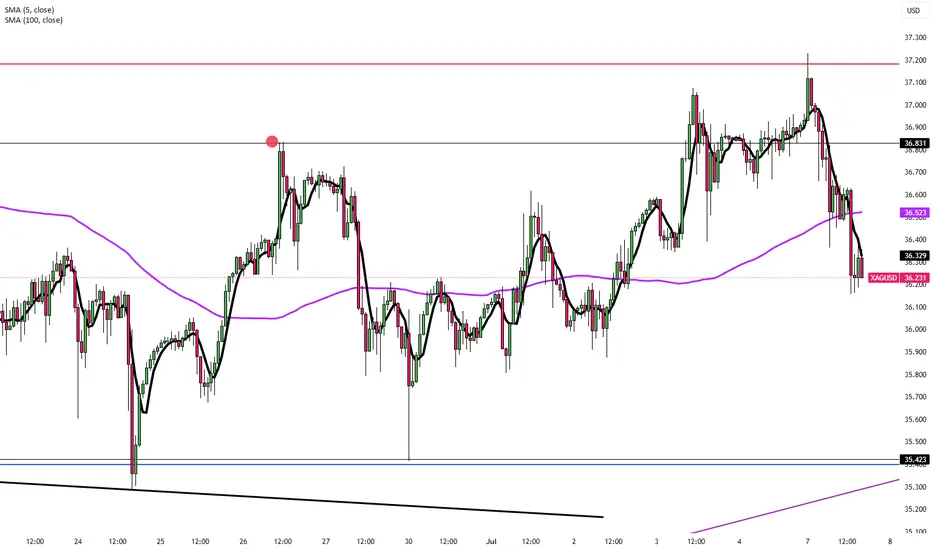
SILVER DAILY TIMEFRAME ANALYSISOn the daily timeframe, silver is currently exhibiting consolidation behavior, indicating indecision in the market.
However, a closer look at the recent price action — highlighted by the green circle — suggests a potential shift in market structure. Price appears to be testing the previous support level, and a confirmed break below this zone could signal a change in trend direction.
If this support level fails to hold, it would confirm a bearish shift, and I will be looking for short opportunities in the near term.
1. Current Trend: Sideways/Consolidation
The chart shows that XAGUSD (Silver) is currently in a consolidation phase after a strong bullish move earlier in May.
Price is ranging between approximately $36.80 and $35.50, forming lower highs and higher lows, indicating indecision or accumulation/distribution
2. Price Structure:
After the strong bullish impulse around mid-May, price has rejected multiple times around the $36.80 zone, showing strong resistance.
The current candles are showing lower closes, and the last candle is bearish, indicating weak bullish momentum and a potential shift to the downside.
There is a minor support zone around $35.85 – $35.80, which price is testing now.
3. Key Levels:
Type Price Area
Resistance 36.78 – 36.80
Resistance 36.45
Current Price 35.98
Support 35.85 – 35.80
Major Support 35.15 – 35.00
Conclusion:
The market is undecided right now but leaning bearish if support breaks.
Wait for a clear breakout of 35.80 for sell continuation.
Alternatively, look for bullish rejection around 35.80 to scalp back to 36.40–36.80 range.
Be patient and manage risk carefully in this range-bound condition.

Possible Movement of Silver: Watch the Golden Zone RetestSilver has broken above a two-top downtrend with a strong bullish impulse, marked by a long white candle. Currently, it appears to be forming a Head and Shoulders pattern. A break below the neckline and the supporting uptrend could lead price back to the golden zone—around the base of the breakout candle—before resuming its upward move toward the main target near $39.

It was good that you waited. Now here's a way to get involved. Over the weekend we took a look at Silver and predicted that we'd probably see an emotional reaction on the open where a lot of (casual traders) look to get involved (due to the headlines) and unfortunately, pay the price for being late.
Now that, that initial group has been shaken out of the market, I want to revisit the metal and show my preferred area for entry along with a conservative approach that you can use if you want to get in earlier.
Please leave any questions, comments, or your trading ideas below.
Give me a follow that way you don't miss my next trading idea.
Akil

SILVER (#XAGUSD): Correction is Over?! #SILVER (#XAGUSD): Correction is Over?! 🪙
It looks like 📈Silver has finally completed a consolidation within
a wide horizontal parallel channel on a daily.
A new higher high formation today indicates coming growth.
I suggest looking for trend-following buy from Monday.
Let the market close above the underlined resistance to let it set a Higher Close
as well.
Look for buying after a pullback, aiming at 38.0 as the first goal.
—————————
Daily time frame
—————————

SILVER: Strong Bullish Sentiment! Long!
My dear friends,
Today we will analyse SILVER together☺️
The market is at an inflection zone and price has now reached an area around 38.768 where previous reversals or breakouts have occurred.And a price reaction that we are seeing on multiple timeframes here could signal the next move up so we can enter on confirmation, and target the next key level of 38.937.Stop-loss is recommended beyond the inflection zone.
❤️Sending you lots of Love and Hugs❤️

SILVER: Strong Bullish Sentiment! Long!
My dear friends,
Today we will analyse SILVER together☺️
The market is at an inflection zone and price has now reached an area around 38.207 where previous reversals or breakouts have occurred.And a price reaction that we are seeing on multiple timeframes here could signal the next move up so we can enter on confirmation, and target the next key level of 38.594.Stop-loss is recommended beyond the inflection zone.
❤️Sending you lots of Love and Hugs❤️

XAG USD LONGSilver Price held the Ascending support Trendline and created and broke out of a minor pennant indicating more movement to the upside, which was why I placed the long setup, and it moved just as Predicted but only missing the high Order block where TP was placed.
Still closed as a B.Even trade though.
Better Setups To Come 😉💪💯
_THE_KLASSIC_TRADER_.🔥

SILVER: Will Go Down! Short!
My dear friends,
Today we will analyse SILVER together☺️
The recent price action suggests a shift in mid-term momentum. A break below the current local range around 36.619 will confirm the new direction downwards with the target being the next key level of 36.530 .and a reconvened placement of a stop-loss beyond the range.
❤️Sending you lots of Love and Hugs❤️

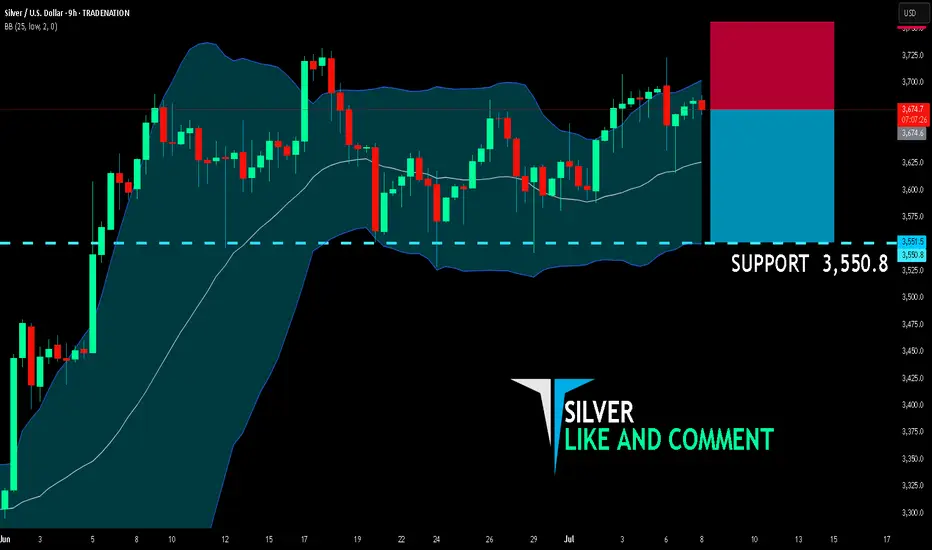
SILVER SENDS CLEAR BEARISH SIGNALS|SHORT
SILVER SIGNAL
Trade Direction: short
Entry Level: 3,674.6
Target Level: 3,550.8
Stop Loss: 3,756.2
RISK PROFILE
Risk level: medium
Suggested risk: 1%
Timeframe: 9h
Disclosure: I am part of Trade Nation's Influencer program and receive a monthly fee for using their TradingView charts in my analysis.
✅LIKE AND COMMENT MY IDEAS✅
Silver Holds Near 13-Year High Amid Tariff UncertaintySilver held above $36.80 Friday, near 13-year highs, as renewed trade tensions supported safe-haven demand. Markets grew cautious after Trump announced plans to send tariff letters, and as the House passed his tax and spending bill, expected to widen the deficit by over $3 trillion. Silver’s gains were capped by a surprisingly stronger June US jobs report, which eased recession fears and reduced near-term Fed rate cut pressure.
Resistance is at 37.50, while support holds at 35.40.
Skeptic | XAG/USD Analysis: Precision Triggers for Spot & FutureHey everyone, it’s Skeptic! 😎 Ready to ride XAG/USD’s next wave? Let’s dive into XAG/USD (Silver) to uncover long and short triggers that can deliver solid profits. Currently trading around $ 36.31 , we’re analyzing Daily and 4-hour timeframes to pinpoint high-probability setups. Here’s the no-nonsense breakdown to keep you sharp. 📊
📈 Daily Timeframe
On the Daily timeframe, we saw a strong primary uptrend sparked by a V-pattern breakout at $ 33.68317 , which drove a 10% rally, as flagged in my previous analyses—hope you caught it! We’re now in a consolidation box, potentially acting as accumulation or distribution. Today’s candle faced a strong rejection from the box ceiling. If it closes this way in 9 hours, the odds of breaking the box floor increase significantly.
Key Supports: If the floor breaks, watch $ 34.78648 and $ 34.41291 as strong reaction zones for potential bounces.
4-Hour Timeframe (Futures Triggers)
On the 4-hour timeframe, let’s lock in long and short triggers:
Long Trigger: Break above resistance at $ 37.29163 , confirmed by RSI entering overbought. Check my RSI guide for how I optimize setups with RSI.
Short Trigger: Break below support at $ 35.59660 , with volume confirmation. Additional confirmation: RSI entering oversold.
Confirmation Timing: Choose your confirmation timeframe based on your style—4-hour, 1-hour, or even 15-minute. I typically confirm triggers on 15-minute closes for precision, but if 1-hour momentum kicks in, I use 1-hour candle closes. Focus on candle body closes, not just shadows, to avoid fakeouts.
Pro Tip: Stick to 1%–2% risk per trade for capital protection.
Final Vibe Check
This XAG/USD breakdown arms you with precise triggers: long at $37.29163, short at $35.59660, with volume and RSI as your allies. The Daily consolidation signals a big move is brewing—stay patient for the ceiling or floor break. Want more cycle-based setups or another pair? Drop it in the comments! If this analysis sharpened your edge, hit that boost—it fuels my mission! 😊 Stay disciplined, fam! ✌️
💬 Let’s Talk!
Which Silver trigger are you eyeing? Share your thoughts in the comments, and let’s crush it together!

SILVER RESISTANCE AHEAD|SHORT|
✅SILVER has been growing recently
And the pair seems locally overbought
So as the pair is approaching a
Horizontal resistance of 3730$
Price decline is to be expected
SHORT🔥
✅Like and subscribe to never miss a new idea!✅
Disclosure: I am part of Trade Nation's Influencer program and receive a monthly fee for using their TradingView charts in my analysis.


SILVER: The Market Is Looking Up! Long!
My dear friends,
Today we will analyse SILVER together☺️
The price is near a wide key level
and the pair is approaching a significant decision level of 36.830 Therefore, a strong bullish reaction here could determine the next move up.We will watch for a confirmation candle, and then target the next key level 36.903.Recommend Stop-loss is beyond the current level.
❤️Sending you lots of Love and Hugs❤️

SILVER: Local Bearish Bias! Short!
My dear friends,
Today we will analyse SILVER together☺️
The in-trend continuation seems likely as the current long-term trend appears to be strong, and price is holding below a key level of 36.897 So a bearish continuation seems plausible, targeting the next low. We should enter on confirmation, and place a stop-loss beyond the recent swing level.
❤️Sending you lots of Love and Hugs❤️

Silver Extends Gains to $36.70Silver hovered near $36.70 on Thursday after rising 1.4% in the previous session, supported by easing trade tensions and stronger expectations of Fed rate cuts.
Markets are now watching key US economic releases to see whether silver can sustain its upward momentum.
Resistance is at 37.50, while support holds at 35.40.

Silver Wave Analysis – 2 July 2025- Silver reversed from support level 35.50
- Likely to rise to resistance level 37.30
Silver recently reversed up with the daily Hammer from the support level 35.50 (which stopped the previous waves (iv) and 4, as can be seen from the daily Silver chart below).
The support level 35.50 was strengthened by the 38.2% Fibonacci correction of the upward impulse from May and the support trendline from April.
Given the clear daily uptrend, Silver can be expected to rise further to the next resistance level 36.80 – the breakout of which can lead to further gains toward 37.30.

