SILVER(Top-Down to H1 Analysis)A simple chart Analysis.Defining the Entry and the 2 Exit Strategy(TP & SL)..You can comment in the section below and Follow for more Video Analysis..ENJOY!!
SILVERCFD trade ideas


Silver is in the bullish trend after testing supportHello Traders
In This Chart XAGUSD HOURLY Forex Forecast By FOREX PLANET
today XAGUSD analysis 👆
🟢This Chart includes_ (XAGUSD market update)
🟢What is The Next Opportunity on XAGUSD Market
🟢how to Enter to the Valid Entry With Assurance Profit
This CHART is For Trader's that Want to Improve Their Technical Analysis Skills and Their Trading By Understanding How To Analyze The Market Using Multiple Timeframes and Understanding The Bigger Picture on the Charts
#XAGUSD – Silver OutlookHere’s your refined and engaging version of the **#XAGUSD (Silver)** analysis, with improved grammar, flow, and added emojis for platforms like TradingView, Instagram, or Telegram:
---
## ⚪ **#XAGUSD – Silver Outlook**
🔮 **What I'm Watching:**
Price is likely to **tap into the Daily Order Block** in the **$28.40–$29.00** area,
which aligns closely with the **0.50 Fibonacci retracement** level 📏.
📌 This zone could act as a **strong reaction point** for buyers.
🕵️ **What to Look For:**
If silver shows **bullish rejection signs** from this zone — ideally a **bullish H4 candle** forming right after tapping it —
then a **small buy setup** could be considered 🎯.
---
📌 As always, wait for proper confirmation — don’t jump in blindly.
Want me to make a visual version for Instagram or share a lower timeframe setup next?
---

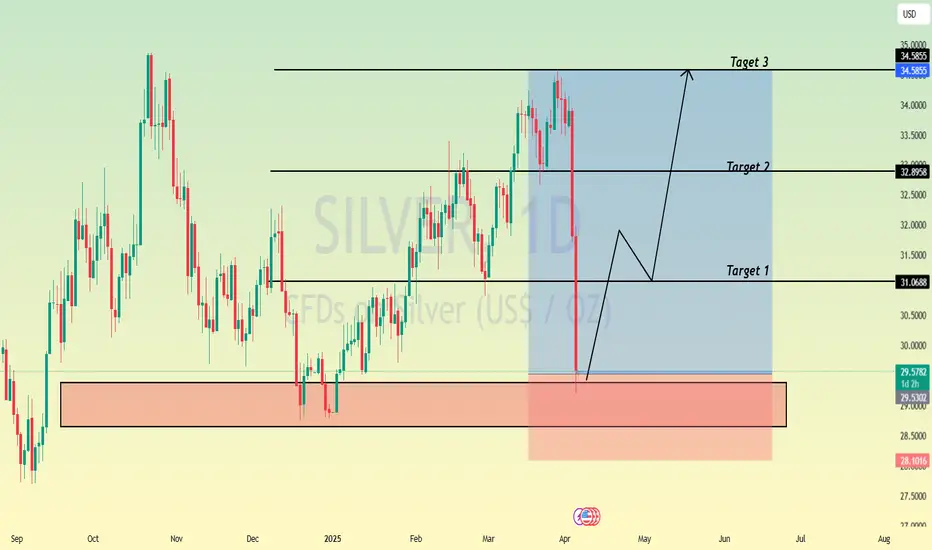
Buy SilverAs long as there is no break in the uptrend on the daily chart, a long position can be attempted from the current level with a target of the previous highs at 34.80-35.00
Since the trade is taking place during a period of high volatility and the entry is not the most stable, it is better to trade with a stop-loss, adjusting it throughout the day as the price moves up.
The first stop is at 31.70. Then, if 32.50 is broken, move it to 32.10, and so on.


XAGUSD Weekly Analysis – Double Top Formation & Breakdown🧱 Chart Pattern Identified: Double Top Formation
The chart displays a classic Double Top pattern, a bearish reversal structure typically found at the end of an uptrend. This pattern forms when price reaches a resistance level twice, fails to break above it both times, and eventually breaks the neckline/support level, confirming a shift in market sentiment.
🔍 Key Components of the Chart:
1. Resistance Level (Tops) – ~$34.25
The market formed two significant peaks around the same level — labeled Top 1 and Top 2.
This level has proven strong resistance, as price was rejected both times after testing this zone.
This zone is marked with a light orange rectangle and a horizontal blue line labeled "Resistance Level".
2. Support Level (Neckline) – ~$28.80
This level served as the neckline of the Double Top.
After the second top, the price sharply declined and is currently approaching this key support zone, highlighted again in light orange.
A clean break and close below this zone on the weekly timeframe will be a strong confirmation of the bearish reversal.
3. Trendline Break – Bearish Shift in Momentum
A rising black dashed trendline supported the prior uptrend.
Price action has now broken below this trendline with strong bearish momentum, indicating that buyers have lost control.
This trendline break adds confluence to the bearish setup, supporting the validity of the pattern.
4. Bearish Projection Target – ~$22.47
The target is projected using the height of the Double Top pattern.
Measured from the resistance level ($34.25) to the support ($28.80), the vertical distance is ~5.45 USD.
Subtracting this from the neckline gives us a projected target:
28.80 - 5.45 = ~23.35 (rounded down to ~22.47 for technical cluster support).
This target area is marked with a blue arrow and labeled "Target" near the horizontal support at $22.47.
5. Stop Loss – ~$34.25
The logical invalidation point is placed just above the resistance zone and the second top.
A move above this level would invalidate the double top pattern, signaling that bulls have regained control.
📈 Price Action and Candlestick Behavior
The strong bearish weekly candle that broke below the trendline shows a decisive shift in sentiment.
The candle's large body and long range confirm institutional selling interest.
Volume (if shown) would likely support the move, but even price structure alone is highly telling here.
🎯 Trading Strategy & Setup
Component Details
Entry On a confirmed break and retest of $28.80 support (neckline)
Stop Loss Above $34.25 (Top 2)
Target $22.47
Risk/Reward ~1:2 or better
Timeframe Weekly (Swing Trade)
Bias Bearish
🧠 Concluding Notes
This chart provides a high-probability bearish setup rooted in classical charting principles. The Double Top is one of the most reliable reversal patterns, especially when:
Formed after a prolonged uptrend (as seen here),
Confirmed with a trendline break,
Followed by strong bearish momentum toward the neckline.
Traders should monitor the support zone around $28.80 closely for a potential breakdown. If confirmed, the target near $22.47 becomes a realistic medium-term objective.


SILVER Strong Support Ahead! Buy!
Hello,Traders!
SILVER got decimated
By the bears last week
And lost almost 15%
Of its value, which is
Clearly an overreaction
And an oversold situation
So after the potential retet
Of the strong horizontal
Support below around 28.97$
On Monday we are likely
To see a bullish correction
Buy!
Comment and subscribe to help us grow!
Check out other forecasts below too!
Disclosure: I am part of Trade Nation's Influencer program and receive a monthly fee for using their TradingView charts in my analysis.

XAG/USD "The Silver" Metal Market Heist Plan(Scalping/Day Trade)🌟Hi! Hola! Ola! Bonjour! Hallo! Marhaba!🌟
Dear Money Makers & Robbers, 🤑💰✈️
Based on 🔥Thief Trading style technical and fundamental analysis🔥, here is our master plan to heist the XAG/USD "The Silver" Metal Market. Please adhere to the strategy I've outlined in the chart, which emphasizes short entry. Our aim is the high-risk Green Zone. Risky level, oversold market, consolidation, trend reversal, trap at the level where traders and bullish robbers are stronger. 🏆💸"Take profit and treat yourself, traders. You deserve it!💪🏆🎉
Entry 📈 : "The heist is on! Wait for the MA breakout then make your move at (33.500) - Bearish profits await!"
however I advise to Place sell stop orders above the Moving average (or) after the Support level Place sell limit orders within a 15 or 30 minute timeframe most NEAREST (or) SWING low or high level.
📌I strongly advise you to set an "alert (Alarm)" on your chart so you can see when the breakout entry occurs.
Stop Loss 🛑: "🔊 Yo, listen up! 🗣️ If you're lookin' to get in on a sell stop order, don't even think about settin' that stop loss till after the breakout 🚀. You feel me? Now, if you're smart, you'll place that stop loss where I told you to 📍, but if you're a rebel, you can put it wherever you like 🤪 - just don't say I didn't warn you ⚠️. You're playin' with fire 🔥, and it's your risk, not mine 👊."
📌Thief SL placed at the nearest/swing High or Low level Using the 1H timeframe (34.200) Day/Scalping trade basis.
📌SL is based on your risk of the trade, lot size and how many multiple orders you have to take.
Target 🎯: 32.800 (or) Escape Before the Target
🧲Scalpers, take note 👀 : only scalp on the Short side. If you have a lot of money, you can go straight away; if not, you can join swing traders and carry out the robbery plan. Use trailing SL to safeguard your money 💰.
XAG/USD "The Silver" Metal Market Heist Plan (Scalping/Day Trade) is currently experiencing a Neutral trend., driven by several key factors.👇
📰🗞️Get & Read the Fundamental, Macro, COT Report, Quantitative Analysis, Sentimental Outlook, Intermarket Analysis, Future trend targets.. go ahead to check 👉👉👉🔗
⚠️Trading Alert : News Releases and Position Management 📰 🗞️ 🚫🚏
As a reminder, news releases can have a significant impact on market prices and volatility. To minimize potential losses and protect your running positions,
we recommend the following:
Avoid taking new trades during news releases
Use trailing stop-loss orders to protect your running positions and lock in profits
💖Supporting our robbery plan 💥Hit the Boost Button💥 will enable us to effortlessly make and steal money 💰💵. Boost the strength of our robbery team. Every day in this market make money with ease by using the Thief Trading Style.🏆💪🤝❤️🎉🚀
I'll see you soon with another heist plan, so stay tuned 🤑🐱👤🤗🤩

SILVER: Long Signal Explained
SILVER
- Classic bullish pattern
- Our team expects retracement
SUGGESTED TRADE:
Swing Trade
Buy SILVER
Entry - 29.598
Stop - 28.563
Take - 31.789
Our Risk - 1%
Start protection of your profits from lower levels
Disclosure: I am part of Trade Nation's Influencer program and receive a monthly fee for using their TradingView charts in my analysis.
❤️ Please, support our work with like & comment! ❤️


SILVER LONG SIGNAL|
✅SILVER fell down sharply
By more than 15% which is
A lot so Silver is clearly oversold
Therefore we can enter a long
Trade with the TP of 30.19$
And the SL of 28.71$
LONG🚀
✅Like and subscribe to never miss a new idea!✅
Disclosure: I am part of Trade Nation's Influencer program and receive a monthly fee for using their TradingView charts in my analysis.


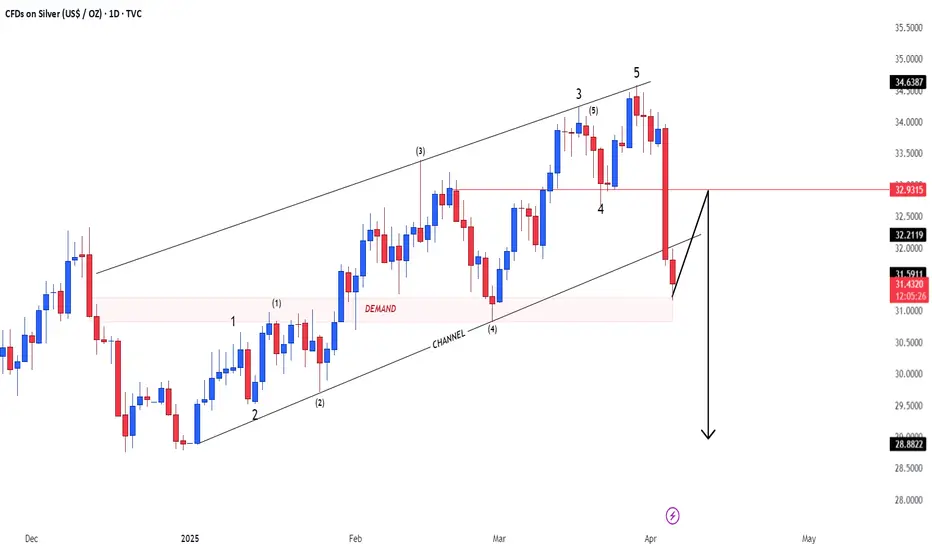
Silver looking like a good buy on technicals, $34 targetI am putting on a small silver position, it really likes to bounce off the up sloping resistance line that is in orange, also indicated by the orange circles where it previously bounced. Good luck and please do your own research. Not financial advice.

SILVER INTRADAY pullback to support at 3090Silver maintains a bullish sentiment, in line with the prevailing uptrend. Recent intraday price action suggests a corrective pullback, potentially retesting the previous consolidation zone for support.
Key Level: 3090
This zone represents a significant area of prior consolidation and now acts as a key support level.
Bullish Scenario:
A pullback toward 3090 followed by a bullish bounce would confirm continued upside momentum. Immediate resistance targets include 3266, with extended upside potential toward 3350 and 3450 over the longer term.
Bearish Alternative:
A confirmed breakdown and daily close below 3090 would negate the current bullish outlook. This would open the door for a deeper retracement toward 3028, followed by 2945.
Conclusion:
Silver remains technically bullish while trading above 3090. A successful retest and rebound from this level would support further upside. However, a daily close below 3090 would shift sentiment bearish in the short term, increasing the risk of a deeper correction.
This communication is for informational purposes only and should not be viewed as any form of recommendation as to a particular course of action or as investment advice. It is not intended as an offer or solicitation for the purchase or sale of any financial instrument or as an official confirmation of any transaction. Opinions, estimates and assumptions expressed herein are made as of the date of this communication and are subject to change without notice. This communication has been prepared based upon information, including market prices, data and other information, believed to be reliable; however, Trade Nation does not warrant its completeness or accuracy. All market prices and market data contained in or attached to this communication are indicative and subject to change without notice.

Silver (XAG/USD) – Long Setup IdeaSilver (XAG/USD) – Long Setup Idea
Silver is currently trading around $31.30, while gold has surpassed the $3,000 mark, pushing the Gold/Silver Ratio (GSR) above 99 – a level that historically signals strong upside potential for silver. Industrial demand is surging, especially from solar energy, EVs, and electronics, with silver consumption expected to exceed 700 million ounces in 2025. Analysts from Capital Economics, UBS, and Citi forecast a price target of $36–38 in the next few months, supported by a persistent supply deficit and investor rotation from gold into undervalued silver.
🎯 Take Profit: $36.00
⏱️ Timeframe: 1–3 months
📊 Bias: Bullish
📉 Risk: Correction below $29 in case of weak macro or strong USD

Detailed Analysis of Silver (XAG/USD) – Double Top BreakoutThe chart represents a technical analysis of Silver (XAG/USD) on the daily timeframe (1D). A Double Top pattern, one of the most reliable bearish reversal formations, is developing. This signals a potential downtrend, with key price levels and trendlines confirming weakness in bullish momentum. Below is a full breakdown of the pattern, price action, and trading setup.
1️⃣ Pattern Formation: Double Top – Bearish Reversal
A Double Top pattern occurs when the price reaches a resistance level twice, failing to break higher. It indicates a shift from a bullish trend to a bearish one.
🔹 Characteristics of the Double Top in This Chart:
First Peak (Top 1 - Resistance at ~$34.57):
The price made a strong move upward, reaching a high near $34.57.
Selling pressure at this level pushed the price downward, forming a support level near $30 (Neckline).
Pullback & Temporary Support (~$30 Neckline):
Buyers stepped in at the support zone, causing a bounce back towards resistance.
This level acted as strong demand, preventing further decline temporarily.
Second Peak (Top 2 - Rejection at Resistance Again):
Price attempted to break above the previous peak but failed.
This failure to form a higher high confirms the presence of strong sellers.
The second rejection strengthens the resistance level at $34.57, signaling exhaustion in buying momentum.
Break of the Trendline Support (Bearish Shift):
A previously ascending trendline (black dashed line) was providing support for the uptrend.
Price broke below this trendline, indicating a possible trend reversal from bullish to bearish.
2️⃣ Key Technical Levels & Trading Setup
🔸 Resistance Zone (~$34.57 - Stop Loss Area)
This is the major resistance level, tested twice and confirmed as a supply zone.
A move above $34.57 would invalidate the bearish pattern, making this an ideal stop-loss level.
🔹 Support Level / Neckline (~$30 - Breakdown Confirmation)
The neckline acts as a critical level. If the price breaks below $30, the Double Top formation is confirmed.
If the price retests this level from below and rejects (fails to reclaim it as support), it becomes a strong short entry signal.
🔻 Target Price (Projected Move - $23.01)
The target is based on the measured move rule of a Double Top:
Distance from resistance ($34.57) to neckline ($30) ≈ $4.57.
Projecting this same distance downward gives a target of ~$23.01.
This aligns with historical demand zones, increasing the probability of price reaching this level.
3️⃣ Trading Plan: Short Setup Execution
🔽 Short Entry (Breakdown Confirmation Below $30)
Ideal entry point is after the neckline breaks and confirms resistance upon a retest.
A breakdown with strong volume enhances the validity of the setup.
🚨 Stop Loss Placement (Above $34.57 Resistance Level)
Placing a stop above the second peak ($34.57) ensures protection against invalidation.
If price moves back above this level, the pattern fails, indicating a potential return to bullish momentum.
🎯 Target Price ($23.01) – Measured Move Projection
The price target aligns with the pattern structure and historical support levels.
Traders can take partial profits at intermediary levels ($27–$26) before full target realization.
4️⃣ Additional Confirmation Factors – Confluence for Bearish Bias
1️⃣ Momentum Indicators: RSI & MACD Bearish Signals
If RSI (Relative Strength Index) drops below 50, it confirms weakening bullish momentum.
A MACD bearish crossover (signal line crossing below the MACD line) would further validate the downtrend.
2️⃣ Volume Analysis – Breakout Confirmation
A high volume breakout below $30 confirms selling pressure.
Low-volume breakdowns can lead to false breakouts, making volume a crucial factor to watch.
3️⃣ Fundamental Factors – Macro Outlook on Silver (XAG/USD)
Silver prices are influenced by interest rates, inflation, and USD strength.
If USD strengthens, silver could face more selling pressure, aligning with this bearish technical setup.
Any hawkish monetary policy statements could accelerate the downside movement.
5️⃣ Risk Management & Alternative Scenarios
✔️ Ideal Risk-Reward Ratio
Risk: Stop loss at $34.57 (~4.5% above entry)
Reward: Target at $23.01 (~23% move)
Risk-Reward Ratio: ~1:5 (highly favorable for short trades)
⚠️ Bullish Invalidations – When to Avoid the Trade?
If Silver reclaims $34.57 and holds above, the pattern fails.
A false breakout scenario could occur if price breaks below $30 but quickly moves back above.
Watching for bullish divergence on indicators like RSI before entering a short position is recommended.
Final Conclusion: Bearish Bias with Strong Downside Potential
📉 Summary of the Bearish Case:
✔️ Double Top pattern confirms a bearish reversal if the neckline breaks.
✔️ Break of ascending trendline signals increasing seller control.
✔️ Key levels: Stop-loss above $34.57 | Entry below $30 | Target $23.01.
✔️ Additional confluence: RSI, MACD, and volume confirmation strengthen the trade setup.
🚀 If price action aligns with this analysis, this setup presents a high-probability short opportunity.
Would you like any refinements or additional insights? 🔥


