SOLUSDT 1,360% profits potential with 8X leverage —LONG tradeMany projects crashed in October or November 2025, new major lows, new all-time lows; pretty bad. Solana remains really strong, just like Bitcoin, Ethereum and some others.
The last low happened mid-December last year and this low ended as a higher low compared to early April 2025. This is a strong
Related pairs

SOL - The Building Block!I call this area the Building Block, and it’s doing exactly what it’s supposed to do.
Right now, CRYPTOCAP:SOL is trading below the $129 structure, and as long as price stays under this level, the bias remains bearish. No guessing, no forcing it. Structure is structure.
That said, this level is

Lingrid | SOLUSDT Momentum Slowdown: Potential ShortBINANCE:SOLUSDT remains capped below a trendline, with the latest rebound stalling inside the 125–127 supply zone. The recovery from the recent low lacks follow-through, and price action continues to form compressed candles, suggesting momentum exhaustion rather than trend reversal. The broader seq

SOL: Setting UP for a Bounce on 4hrs TF.SOL finally came to a good buy zone after a nice consolidation.
Whatever price drop in the next 1 to 2 days (If stays in range much better) that will mark the start of the 4hrs TF bounce.
Buckle UP ladies and gentlemen and put on those boogie shoes and get ready to dance the Bullas dance.
Would b

SOLUSD is showing buy interest from the key support area 128.10🟢SOLUSD – Bullish Buy Setup 📈
SOLUSD is showing buying interest from the key support area at 128.10. Price action on the 15-minute timeframe suggests short-term bullish momentum, with buyers stepping in from support.
📍 Buy Zone: 128.10 (Support)
🎯 Technical Targets:
• TP1: 129.60
• TP2: 130.60
• T

SOLANA ON DISCOUNT PRICE BASED ON STRUCTURESolana is a high-performance blockchain platform designed for speed, scalability, and low transaction costs, using a hybrid Proof-of-History (PoH) and Proof-of-Stake (PoS) consensus. Its ecosystem supports a wide range of decentralized applications (dApps) across DeFi, NFTs, gaming, DePIN, and AI.
C

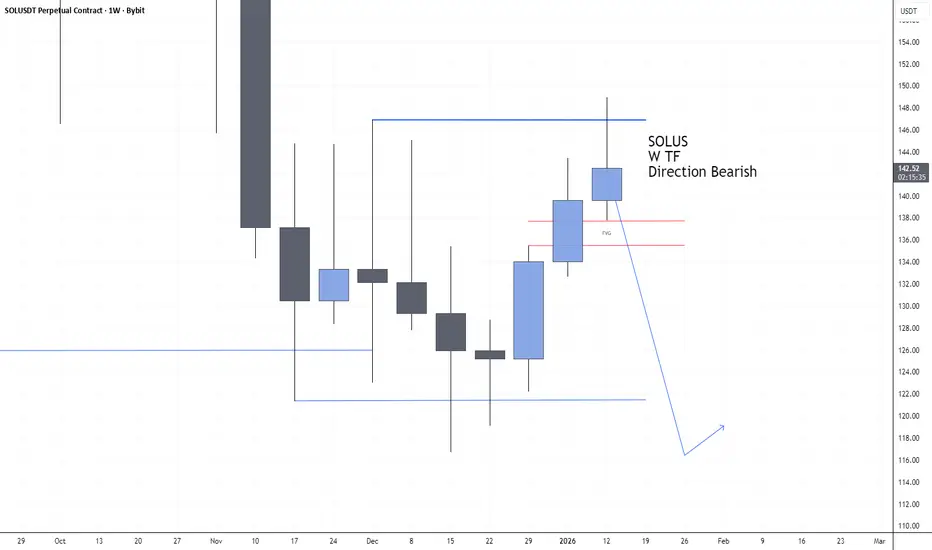
SOLUSD bearish Sign?looking at weekly chart looks like SOL most likely bearish setup.
Of course I was Bullish last week but looking at the candle closing inside wick possible short.
SOL/USDT Approaching Key Demand – Bounce or Breakdown?Technical Analysis:
Price Structure: After printing a recent lower high, SOL is undergoing a sharp correction toward dynamic support levels.
Point of Control (POC): Based on the Volume Profile (VPVR), the $127.39 area is the current POC. The price is consolidating exactly at this high-volume node.

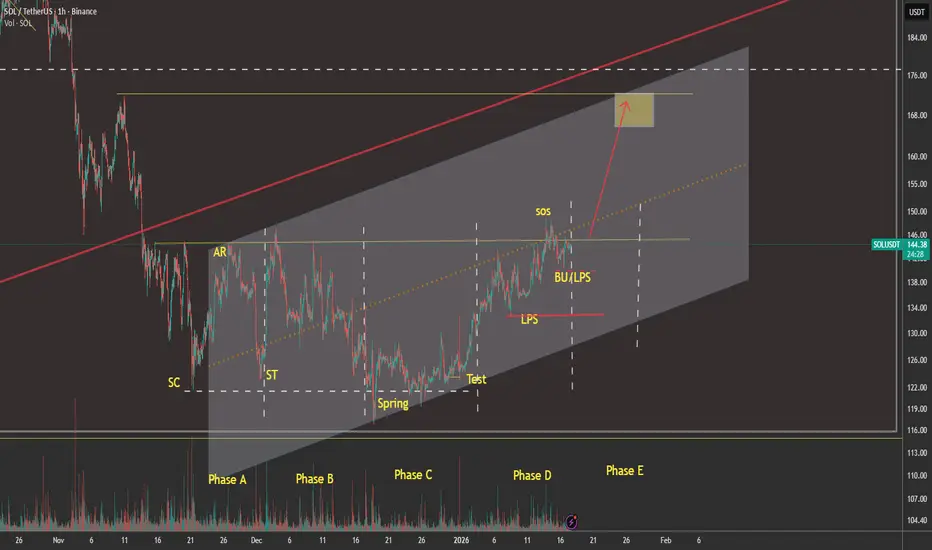
SOLUSDT - $172 in 10 days? 1H — Wyckoff details
For education purpose, I have drawn the different phases. This is a very short term trade. Be very careful after this one. We have a major shakeout brewing.
Clean Wyckoff accumulation on the 1H.
• Phase A: Selling Climax + Automatic Rally
• Phase B: Range absorption
• Phase C: Spring + reclaim
Don’t Panic With SOL – The Market Is Offering an OpportunitySOLUSDT currently looks like a deep correction within a broader uptrend, rather than a trend reversal. Recent news has mainly created short-term psychological pressure across the crypto market, while Solana’s fundamentals remain solid: institutional capital has not exited aggressively, staking level

See all ideas
Summarizing what the indicators are suggesting.
Oscillators
Neutral
SellBuy
Strong sellStrong buy
Strong sellSellNeutralBuyStrong buy
Oscillators
Neutral
SellBuy
Strong sellStrong buy
Strong sellSellNeutralBuyStrong buy
Summary
Neutral
SellBuy
Strong sellStrong buy
Strong sellSellNeutralBuyStrong buy
Summary
Neutral
SellBuy
Strong sellStrong buy
Strong sellSellNeutralBuyStrong buy
Summary
Neutral
SellBuy
Strong sellStrong buy
Strong sellSellNeutralBuyStrong buy
Moving Averages
Neutral
SellBuy
Strong sellStrong buy
Strong sellSellNeutralBuyStrong buy
Moving Averages
Neutral
SellBuy
Strong sellStrong buy
Strong sellSellNeutralBuyStrong buy
Displays a symbol's price movements over previous years to identify recurring trends.
Frequently Asked Questions
The current price of SOL / TetherUS (SOL) is 115.65 USDT — it has fallen −6.78% in the past 24 hours. Try placing this info into the context by checking out what coins are also gaining and losing at the moment and seeing SOL price chart.
SOL / TetherUS price has fallen by −9.79% over the last week, its month performance shows a −5.22% decrease, and as for the last year, SOL / TetherUS has decreased by −49.31%. See more dynamics on SOL price chart.
Keep track of coins' changes with our Crypto Coins Heatmap.
Keep track of coins' changes with our Crypto Coins Heatmap.
SOL / TetherUS (SOL) reached its highest price on Jan 19, 2025 — it amounted to 295.83 USDT. Find more insights on the SOL price chart.
See the list of crypto gainers and choose what best fits your strategy.
See the list of crypto gainers and choose what best fits your strategy.
SOL / TetherUS (SOL) reached the lowest price of 1.03 USDT on Dec 23, 2020. View more SOL / TetherUS dynamics on the price chart.
See the list of crypto losers to find unexpected opportunities.
See the list of crypto losers to find unexpected opportunities.
The safest choice when buying SOL is to go to a well-known crypto exchange. Some of the popular names are Binance, Coinbase, Kraken. But you'll have to find a reliable broker and create an account first. You can trade SOL right from TradingView charts — just choose a broker and connect to your account.
Crypto markets are famous for their volatility, so one should study all the available stats before adding crypto assets to their portfolio. Very often it's technical analysis that comes in handy. We prepared technical ratings for SOL / TetherUS (SOL): today its technical analysis shows the sell signal, and according to the 1 week rating SOL shows the sell signal. And you'd better dig deeper and study 1 month rating too — it's sell. Find inspiration in SOL / TetherUS trading ideas and keep track of what's moving crypto markets with our crypto news feed.
SOL / TetherUS (SOL) is just as reliable as any other crypto asset — this corner of the world market is highly volatile. Today, for instance, SOL / TetherUS is estimated as 5.35% volatile. The only thing it means is that you must prepare and examine all available information before making a decision. And if you're not sure about SOL / TetherUS, you can find more inspiration in our curated watchlists.
You can discuss SOL / TetherUS (SOL) with other users in our public chats, Minds or in the comments to Ideas.