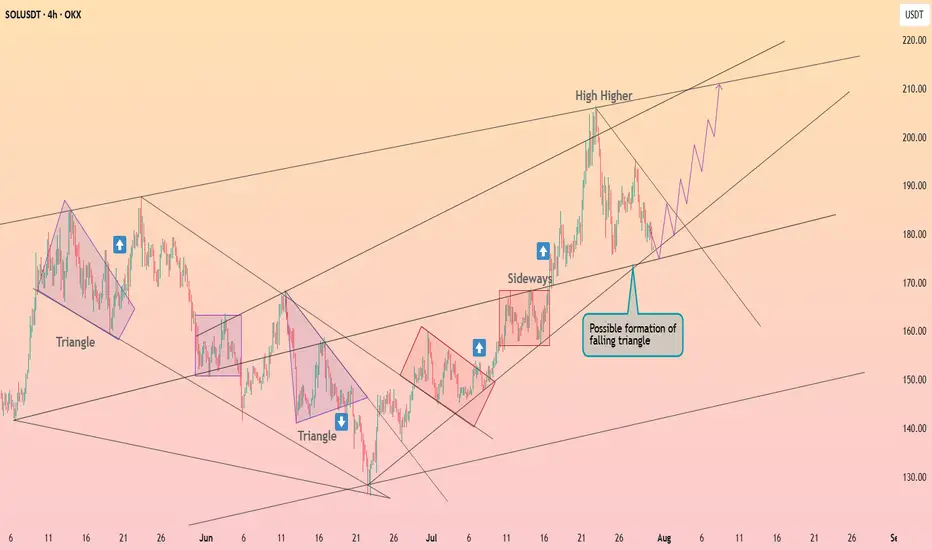
Solana is forming the falling triangle ┆ HolderStatOKX:SOLUSDT is compressing into a possible falling triangle, with support around 180–185 and upward projections pointing toward 210+. The chart has repeatedly shown triangle breakouts into strong rallies. As long as the lower trendline holds, the upside setup remains valid.
SOLUSDT.P trade ideas
BEARISH TREND STARTI SEE ll and lh is bearish trend start ? just look at the hight and low its make ll and lh resistance area is about 182 support area is 170 to 172

Break down before the run upSo i feel this will go to the 4 hr OB. My reasoning is there's very little buy volume, the OBV is very low even though the price climbed a bit, and the RSI is below 50 still, so still bearish imo. But the market has its own ideas so be wary and watch closely. Make money my friends!

Short Executed alreadyAs I predicted the liquidity pool was raided but it didn't go back to my entry before running.
Congratulations if you got in at market entry
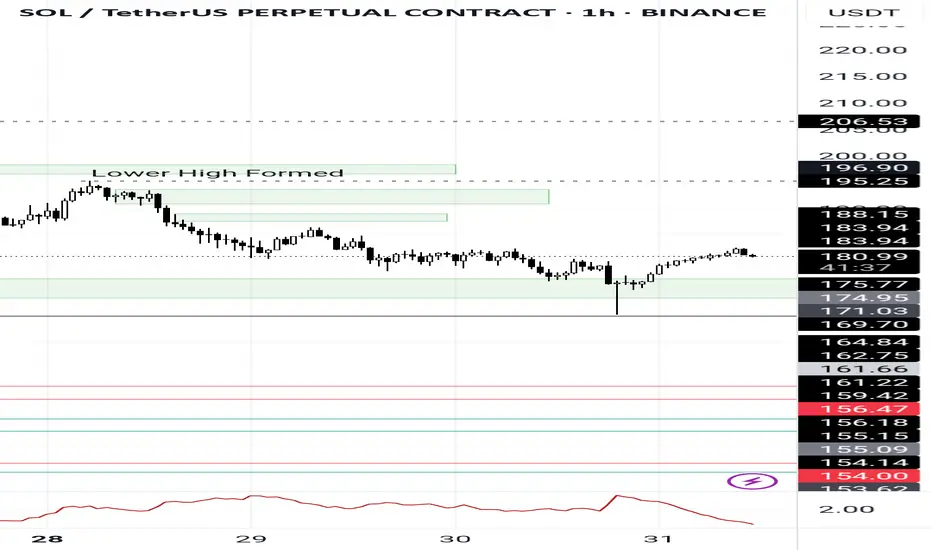
SOLANA could have a major retracement Solana completed a major ABC correction into a supply zone on the higher time frame (HTF), taking out the previous quarter’s highs.
On the daily chart, the RSI is overbought and signals the potential for a significant retracement.
Price action on the 4-hour chart shows a series of lower highs, indicating a bearish trend. If Solana fails to break above the previous high and trigger a market structure shift, the downtrend is likely to continue, leading to a deeper retracement on the higher time frames.

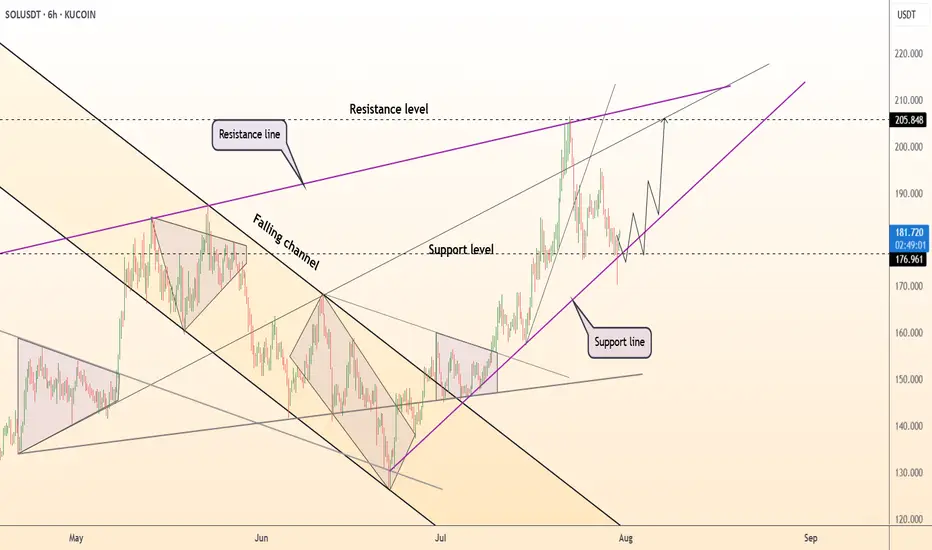
DeGRAM | SOLUSD is holding the $177 level📊 Technical Analysis
● SOLUSD is bouncing from the rising trendline support at 177 after a retracement, maintaining structure within a bullish ascending wedge.
● Price holds above the prior resistance-turned-support near 176.9, with a clear path to retest the 205.8 and 219–222 confluence zone.
💡 Fundamental Analysis
● Solana's 30-day DApp volume ranks top 3 among L1s, signaling increased utility. Institutional SOL inflows also continued for a fifth week, per CoinShares.
● Strong user metrics and positive funding rates suggest bullish momentum remains supported on-chain and through derivatives markets.
✨ Summary
Buy dips above 177. Targets at 205 ▶ 220. Long setup holds while price stays above 175.
-------------------
Share your opinion in the comments and support the idea with a like. Thanks for your support!
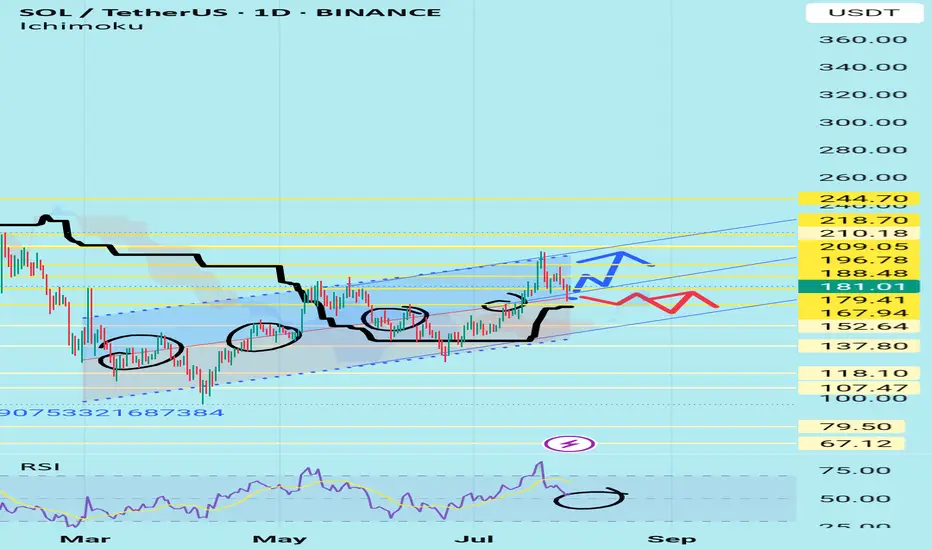
SolusdtHi snipers. On the one-day timeframe, the price is fluctuating in an ascending channel. It has now reached the middle line of the channel and the 103-day moving average support line is below it, which will help the price to move up again and reach the channel ceiling. If this support is broken, the price is likely to fall to the channel floor. This analysis is just a possibility. It is not a trading recommendation.
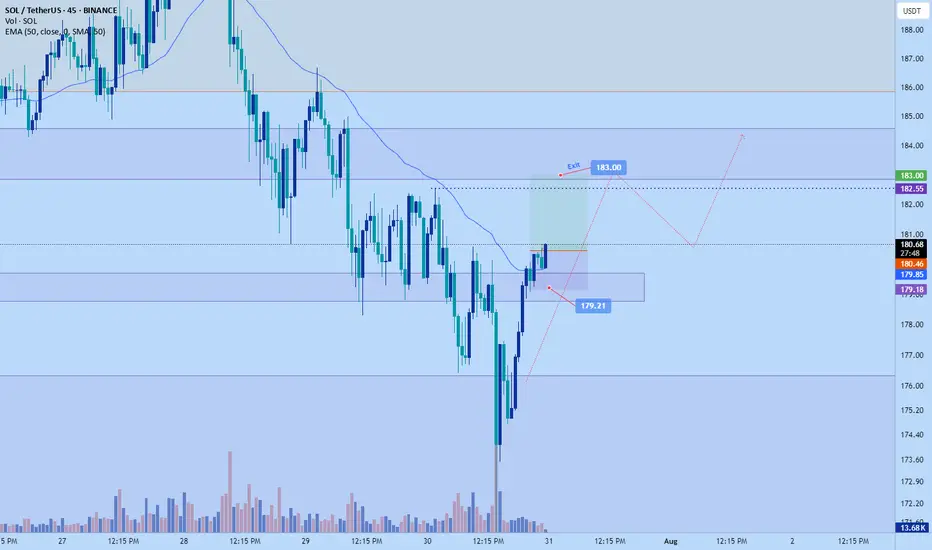
Solana scalp long to $183Just now opened a scalp long position on solana. Bulls are taking back control breaking resistance levels and no clear sign of exhaustion yet.
Sl: $179.21
Tp: $183
Roughly 2 RR
DTT strategy applied. - Direction , target and timing
Soul for souls Our BTC target was on spot and exceeded our expectations
Alts will follow and now everything looks set and more clear could be the real alt season,
Anyhow my target for soulusdt and I was being conservative I do expect it to go higher but that down to preference
Enjoy

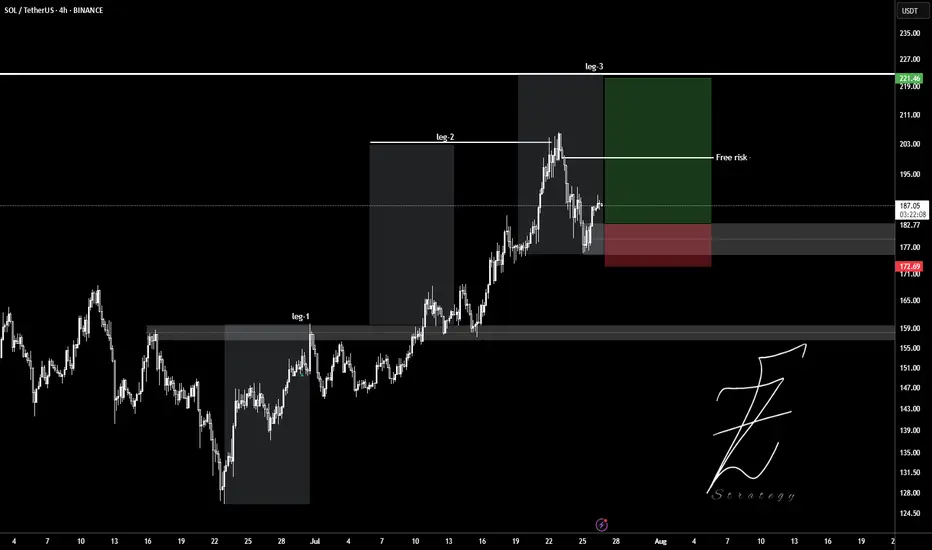
SOLUSDTWait for pollback to 180$ level and ready to get buy position.
Target set in leg2 and leg3.
Entry: 182
Stop: 177
Tp: 190 - 200 - 210 - 220
Please control Risk management.


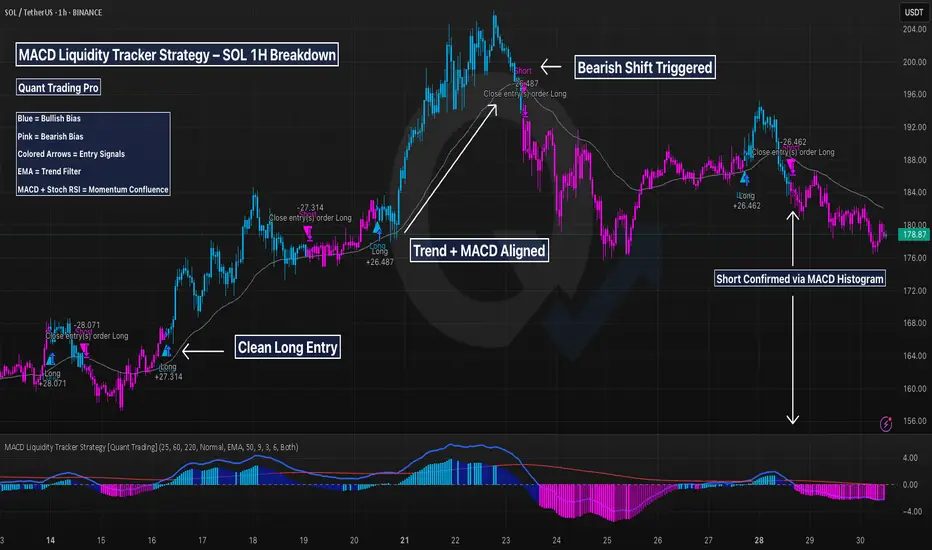
SOL 1H – How This MACD Strategy Filters Noise & Times SwingsThis chart showcases the MACD Liquidity Tracker Strategy applied to Solana’s 1H timeframe — designed to help traders capture clean trend moves while avoiding noisy whipsaws.
The system combines:
✅ MACD momentum filtering (25 / 60 / 220)
✅ 9 & 50-period moving average confirmation
✅ Stoch RSI confluence
✅ State memory logic to reduce false flips
🔍 Strategy Breakdown:
Entry Conditions:
Buys trigger when MACD histogram shifts bullish, the trend filter confirms, and momentum aligns with Stoch RSI. Shorts trigger on the inverse.
Visual Context:
Blue candles = Bullish state
Pink candles = Bearish state
Gray line = Confirmation filter (EMA)
Performance Example:
Caught two major long legs: +27.31 and +26.46
Avoided most chop through clear color-shifting logic
Recent short called the local top with MACD + trend confluence
📌 Why It Works:
The strategy focuses on structure first, signal second — letting trend context and MACD compression guide entries. Unlike traditional crossovers, this approach uses liquidity-aware thresholds to reduce noise and keep traders in the right trend longer.
🧠 Ideal For:
Swing traders on LTFs (15m–4H)
Crypto traders wanting cleaner confirmation
Anyone backtesting with QuantTradingPro or building a trend-following system
This chart shows how combining indicators into a rules-based system can help you trade with clarity — not emotion.
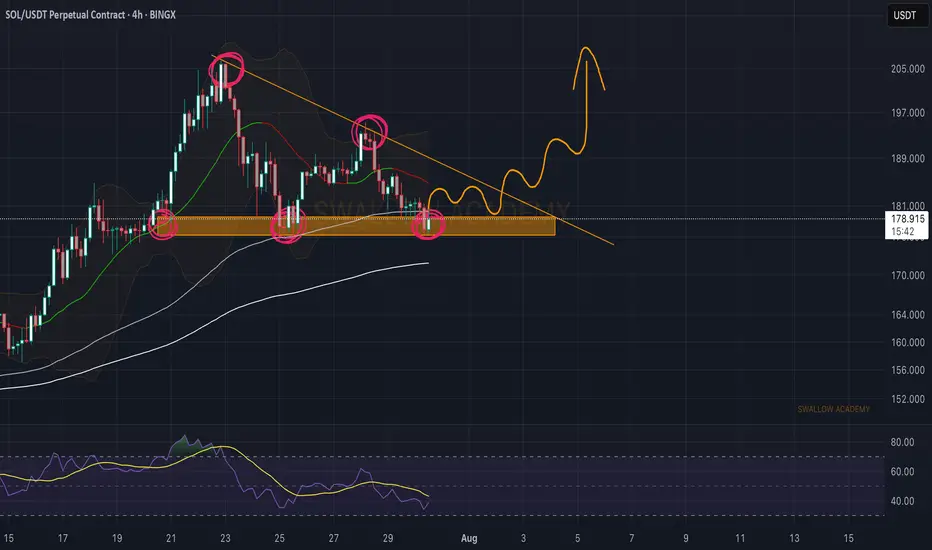
Solana (SOL): Triangle Pattern | Waiting For Bullish BreakoutSolana failed to break down from the local neckline zone (or support zone, for those who want to call it that). What we got instead is buyside dominance, where buyers took back the area and are now pushing the price back toward the upper side of that triangle pattern, so that's where our current target is sitting, as long as we break that line.
Swallow Academy
SOLANASolana showing a great bounce and strong buy back with an active escalation. Expecting to hit $200 and above this days. IMHO.
NFA - DYOR

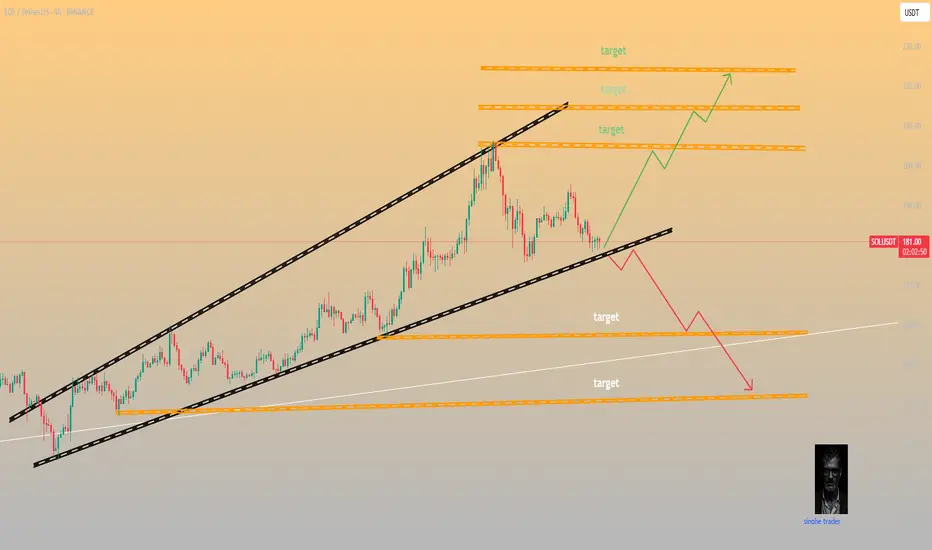
SOL ideas, which one you think gonna play? green or blue?SOL and crypto likely in the last corrective wave before going much higher

Possible Double bullish flag for #SOLThere is a world where SOL is confirming this double bullish flag setup for New Higher Highs...Let's wait and see. It needs to hold the 179 -178 line and keep and eye on Volume for a healthy push until the next Fibo level around 220.
The only pb is August has always been a bad month for crypto in gnl. Trade carrefully ! Educational content only

FUTURES SIGNALFUTURES SIGNAL
Coin: SOL
Direction: LONG
🟢Input range: 179,5-179,7
✔️ТР: 182,47
❌SL: 178,11
Hedge scalp long after liquidity withdrawal. Target order block at 182.4. Stop behind PDL

Short-Term "Counter-Short" Position A "counter-short" strategy, Short-Term "Counter-Short" Position
A "counter-short" strategy, also known as counter-trend trading, involves taking a short position against the prevailing short-term trend, anticipating a temporary reversal or correction. This is generally a high-risk, high-reward strategy that requires precise timing and strong risk management.
Long-term long positions on SOL/USDT with a cup and handle pattern aim for substantial gains after a period of consolidation. This strategy relies on identifying a well-formed bullish continuation pattern on higher timeframes, confirmed by volume, to indicate a strong upward trajectory for Solana. till previous ATH
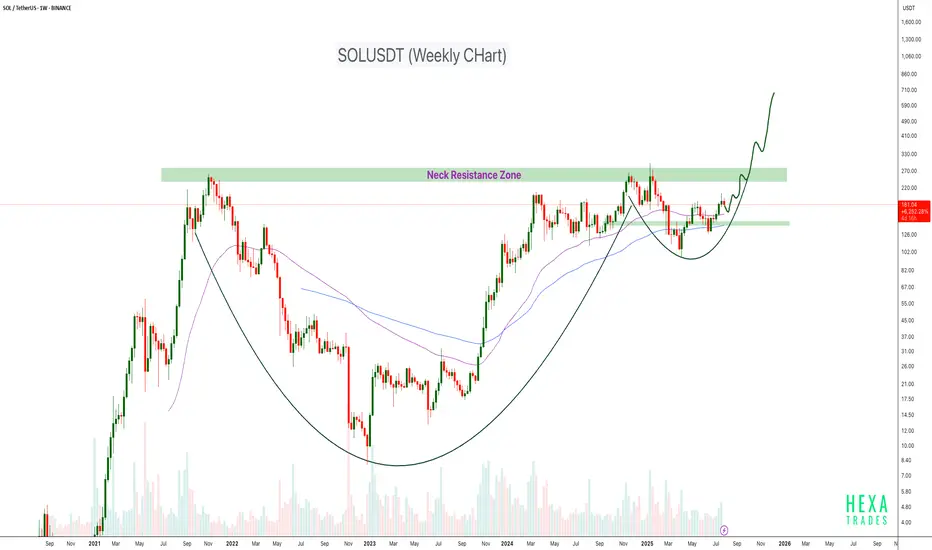
SOLUSDT Cup & Handle Formation CRYPTOCAP:SOL is forming a large Cup and Handle pattern on the weekly timeframe, a classic bullish continuation structure. Price is currently approaching the neckline resistance zone around the $250–$280 level. This area has acted as a major barrier in the past, rejecting the price multiple times, but the structure suggests it's now being retested with greater momentum.
If the neckline breaks cleanly with strong volume, the projected target could push SOL into the $600–$700+ range over the coming months.
Cheers
Hexa
BINANCE:SOLUSDT COINBASE:SOLUSD
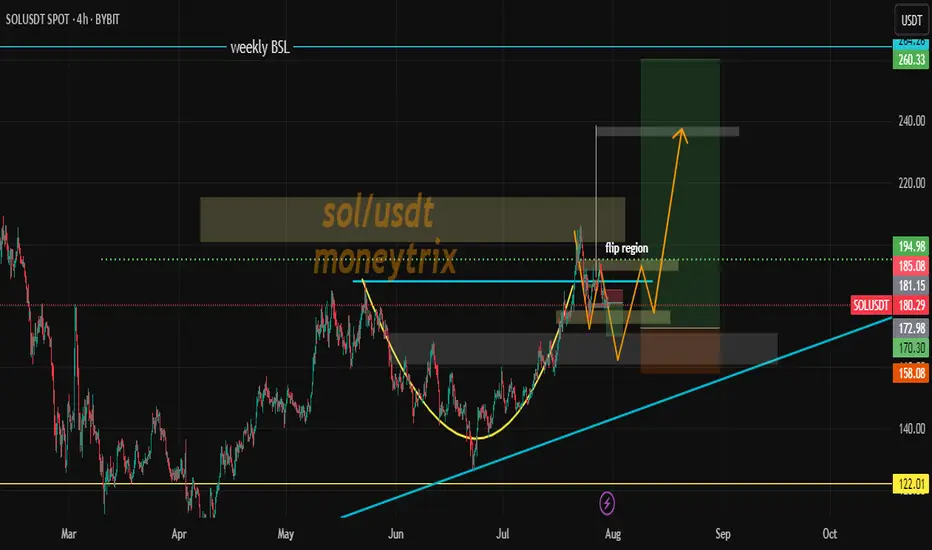
SOL Both scenarios are valid! SOL is still bullishSOL Both scenarios are valid! SOL is still bullish
SOL is in a critical zone. The price is still inside a large bullish pattern and as long as it stays inside the pattern, the trend remains bullish and SOL should follow the bullish scenario.
The bullish targets are at 205, 214 and 224
It may happen that the FOMC will bring surprises, so if SOL manages to break below the pattern, it will activate the bearish scenario after that and the chances of falling will increase further as shown in the red scenario.
The bearish targets are at 160 and 139
You may find more details in the chart!
Thank you and Good Luck!
PS: Please support with a like or comment if you find this analysis useful for your trading day
SOL gives a SOUL!SoL just has happened as I told and mentioned earlier, this range looks very lucrative as of now and can turn things in a good manner! Observe where it goes

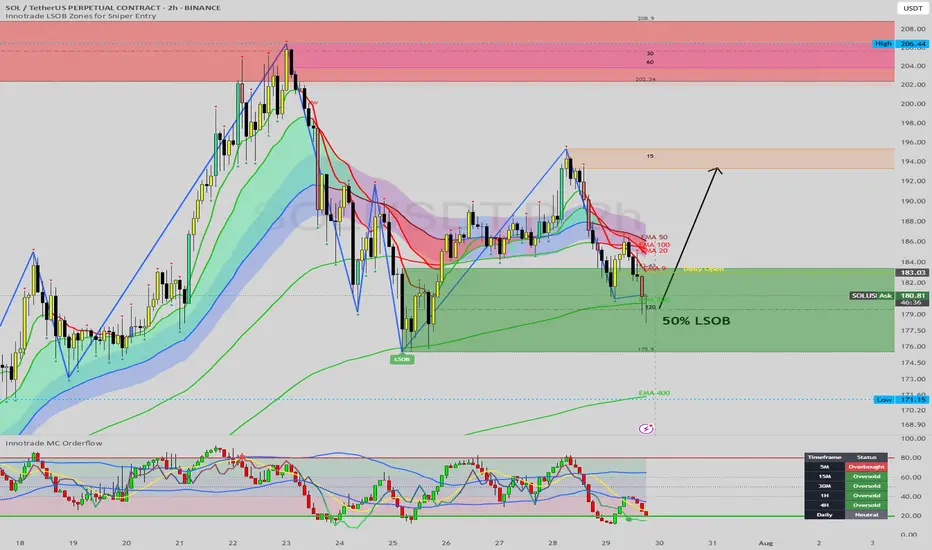
SOL Taps Major Demand: A High-Confluence Long Setup at EMA 200Hello, traders.
Today we are examining Solana (SOL), which has just pulled back into a technically significant area of interest after a strong rejection from the $206 highs. While the recent drop has been sharp, it has brought the price into a major demand zone that aligns perfectly with key long-term support levels.
This analysis provides a step-by-step breakdown of the confluent technical factors suggesting that the current level offers a high-probability opportunity for a bullish reversal and the continuation of the primary uptrend.
The Analysis: Stacking the Bullish Confluences
A robust trading idea is formed when multiple, independent technical signals align. On this 2-hour chart for SOL, we have a powerful convergence of factors:
1. Primary Market Structure (Uptrend Intact):
First and foremost, the context is bullish. The Zig-Zag indicator clearly shows a well-defined uptrend with a series of higher highs and higher lows. The current price action, while corrective, is still holding above the previous major low. As long as this structure holds, our bias should be to buy the dips in anticipation of the next leg up.
2. The Institutional Demand Zone (LSOB):
Price has now entered the large green LSOB (Liquidity Sweep Order Block), a critical zone spanning from roughly $175.5 to $183. These zones represent areas where significant buying interest and institutional order flow previously entered the market. The price has wicked directly into this demand zone, indicating a reaction from buyers.
3. Dynamic Support Confluence (The EMA 200):
Adding immense strength to this demand zone is the EMA 200, which is flowing directly through the middle of the LSOB. The EMA 200 is a widely respected long-term moving average that often acts as powerful, dynamic support in an uptrend. The fact that price has respected this level almost to the dollar is a strong confirmation of its significance.
4. Multi-Timeframe Momentum Exhaustion:
This is perhaps the most compelling timing signal. Our MC Orderflow oscillator is deep in the green "Oversold" territory, indicating that selling pressure on this timeframe is exhausted.
More importantly, the Dashboard reveals that this condition is widespread. The 15M, 30M, 1H, and 4H timeframes are all simultaneously flashing "Oversold." This cross-timeframe alignment of momentum exhaustion is a powerful signal that the corrective move is likely nearing its end.
5. Fibonacci Time Cycle:
A small but significant detail is the Fibonacci Time Cycle icon (the lightning bolt) that appeared near the recent low. These cycles can often mark key turning points in time, suggesting that the market is chronologically primed for a potential pivot.
The Potential Trade Plan
Based on this powerful stack of confluences, here is a potential trade plan:
Entry Zone: The current LSOB / EMA 200 area, from $179 to $181, represents a strong zone for entries.
Stop Loss: A logical stop loss can be placed just below the LSOB and the recent swing low, around $174.50. A break of this level would invalidate the bullish structure.
Potential Targets:
Target 1: A reclaim of the Daily Open at 186
Target 2: The intermediate supply zone and recent swing high around $194 - $196.
Target 3: A full retest of the major high at $206.
Conclusion
We have a textbook example of technical confluence: a pullback to a major LSOB demand zone that aligns perfectly with the long-term EMA 200, all while multi-timeframe momentum indicators show clear seller exhaustion at a potential time-based turning point. This presents a compelling, high-probability case for a long position on Solana.
Disclaimer:
This analysis is for educational purposes only and does not constitute financial or investment advice. Trading involves a high level of risk. Always conduct your own thorough research and consult with a licensed financial advisor before making any trading decisions.