SOL / TetherUS PERPETUAL CONTRACT
174.67USDTR
+1.03+0.59%
As of today at 18:57 GMT
USDT
No trades
SOLUSDT.P trade ideas
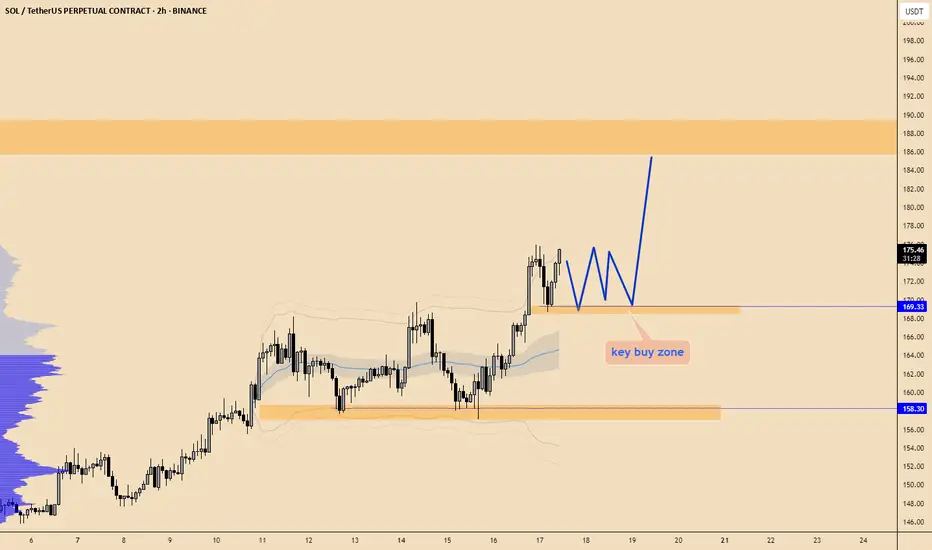
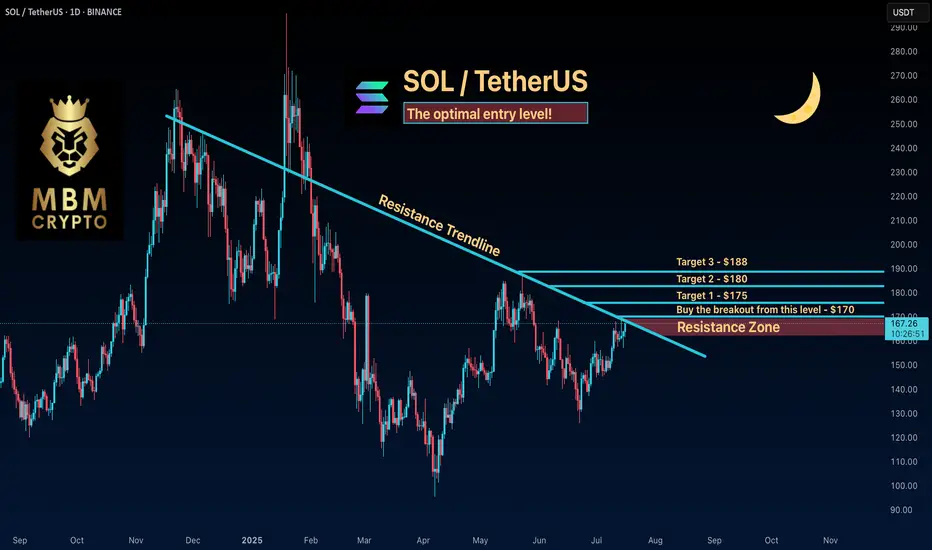
SOL: The optimal entry level! Keep an Eye on SOL
Now is the time to watch SOL. If the price breaks to the upside, we could see a significant move that might take it above $190!
Trading Setup
If you’re considering trading SOL, here’s a quick setup that may help you.
The idea is: Buy when the price breaks above $170 and take profits at the levels shown in the chart.
Targets:
1. $175
2. $180
3. $188
-------------------------------------------
About our trades:
Our success rate is notably high, with 10 out of 11 posted trade setups achieving at least their first target upon a breakout price breach (The most on TW!). Our TradingView page serves as a testament to this claim, and we invite you to verify it!


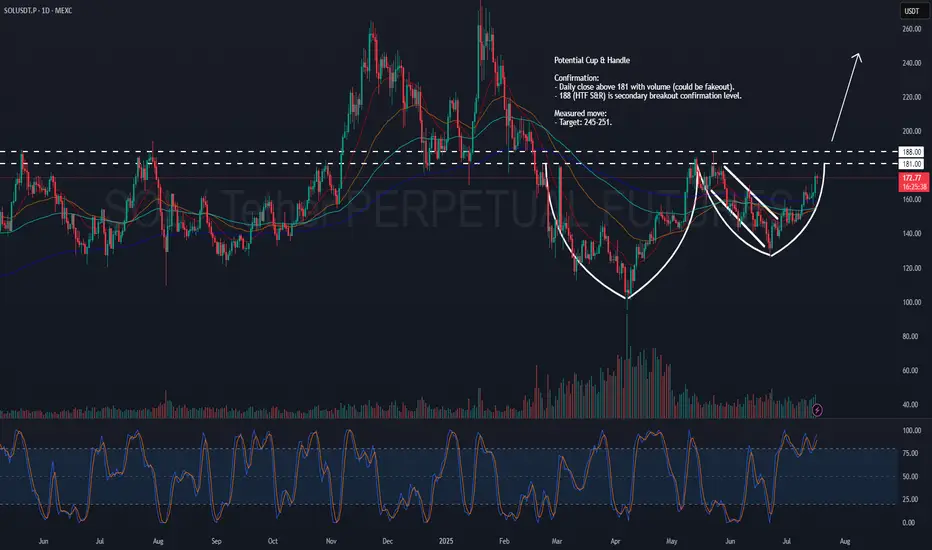
SOL – Potential Cup & HandleSOL might be shaping up to be a pretty clean cup & handle .
Could be big, but we’re not there just yet.
Levels I’m watching:
181: Main neckline. Want to see a daily close above with volume.
188: HTF S&R — secondary confirmation. Clears this, and I’d say the move is real.
Measured target:
Somewhere around 245–251 if it plays out.
Let’s see if SOL has more in the tank.
Weekly trading plan for SolanaLast week, BINANCE:SOLUSDT price followed our bullish scenario after breaking out from the ABCDE triangle. We’ve now hit all projected targets, with current trading around $165. However, the 4-hour RSI is showing divergence, suggesting potential near-term correction or consolidation. Full analysis in the video idea
Trade safe and stay adaptive

SOL - Grab the bad highs??If you zoom out on H4, you see that SOL just didn't take the highs there, creating bad highs with our current high.
I'm looking at this little range, hoping we get another small pullback into the fvg on m5, where we can have a clean long into those highs.
I kept the stop rather tight, because the lows are bad lows as well, so it's possible we get stopped, but then get a sweep to try again.
The market saw a lot of upside in little time, be careful with managing risk with these kind of toplongs.

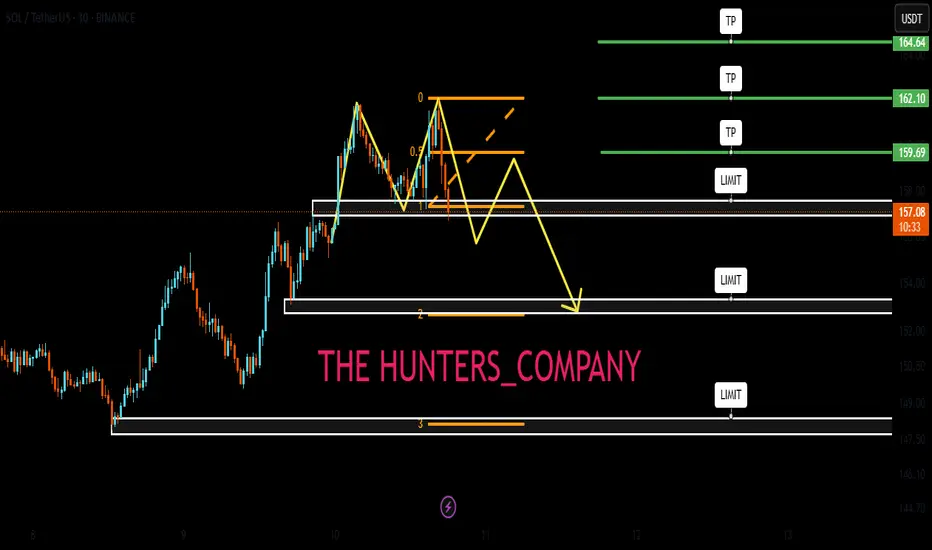
#SOL Update #4 – July 15, 2025#SOL Update #4 – July 15, 2025
Solana’s latest impulsive move failed to close significantly higher than the previous one. In fact, they closed at nearly the same level, which raises the risk of a potential double top pattern.
Looking at the current 4-hour chart, Solana seems to be nearing the end of this move. If the $157 support level breaks, it would likely indicate a transition from a bullish to a bearish structure on the 4H timeframe. The first target in such a breakdown would be around $154. If the $154 support fails to hold, the second target would be near $149.
Volume currently appears quite low, and the presence of long upper wicks adds further risk. Given the current conditions, Solana looks quite risky, and I do not recommend any trading positions—either buy or sell—at this time.

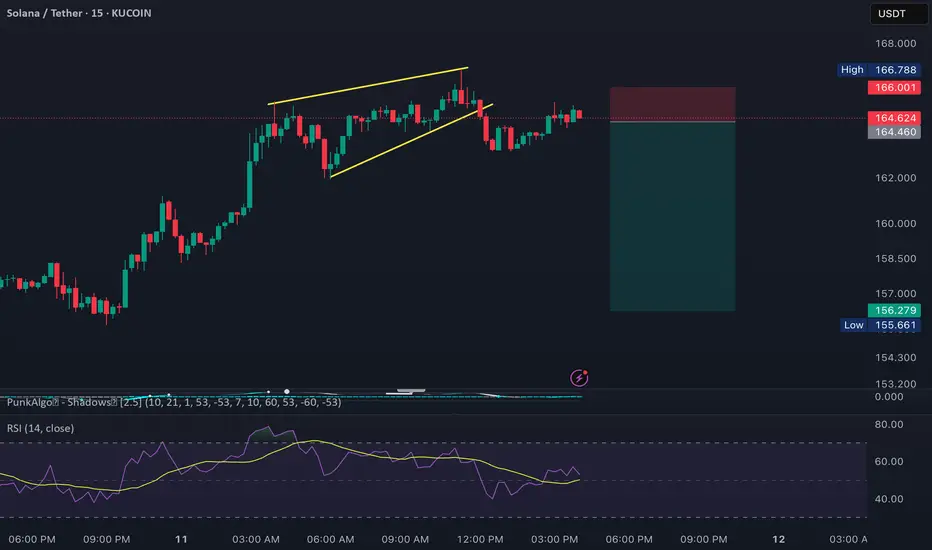
SOL Breakdown: Short Opportunity Before the Next Bull RunSOL is approaching resistance and has broken the rising wedge on the 15-minute timeframe. A significant dip is likely before the actual bull run begins.
Short entry: Around $164.50
Stop-loss: $166 – $166.50
Take-profit targets: $160 and $156
This setup offers a good scalping opportunity in the short term.
Solana:Daily free signalhello friends👋
As you can see, after the drop that we had, insider buyers showed and were able to support the price well.
But it was not enough, and as you can see, a noisy pattern has formed, which can indicate a further decrease in the price.
Now we can take advantage of this opportunity and make step-by-step purchases with risk and capital management in the support areas that we have obtained for you and move to the specified goals.
🔥Follow us for more signals🔥
*Trade safely with us*

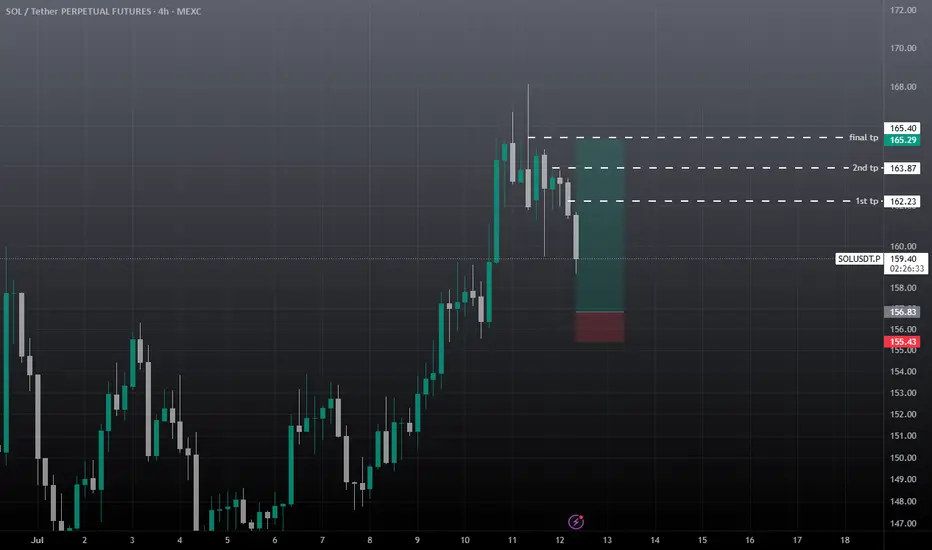
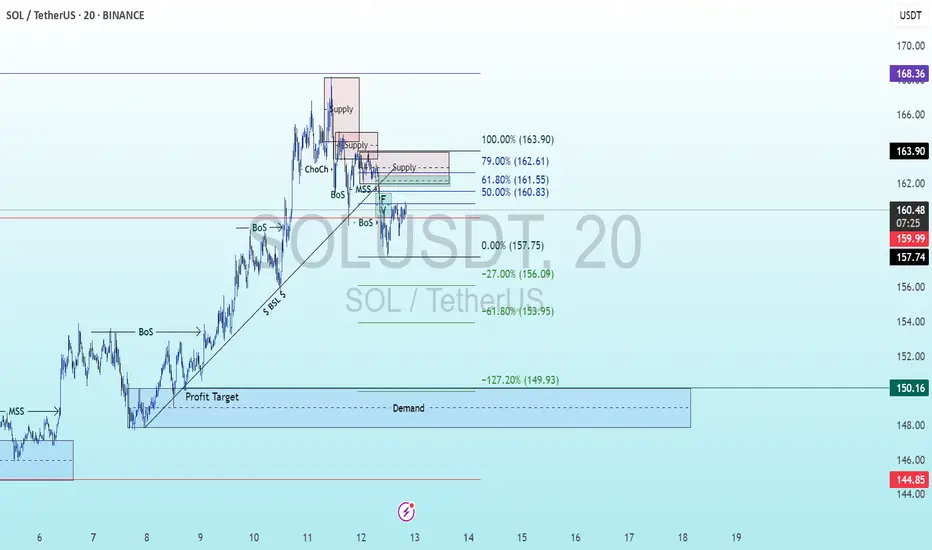
SOL Swing long - MTF ConfluencePositioning for a swing long entry on SOL based on alignment across Weekly, Daily, and 4H.
Weekly structure is bullish with clean HL-HH sequence. Stochastic RSI still rising = potential momentum continuation.
Daily structure remains bullish with HL-HH and is valid unless price closes below 146.5. Volume profile shows POC around 152.2.
On the 4H there´s a clear volume cluster around my entry, confirming heavy accumulation and interest. EMA 100 & 200 on 4H sits right beneath = dynamic support.
Trade Setup (SOL limit long order)
Entry: 153.6 (within OB & FVG)
SL: 146.5 (below OB & invalidation level)
Targets:
TP1: 164.90 → +1.59R (50% out, move SL to BE)
TP2: 179.00 → +3.58R (30% out)
TP3: 215.00 → +8.65R (20% runner)
DISCLAIMER: I am not providing trading signals or financial advice. The information shared here is solely for my own documentation and to demonstrate my trading journey. By openly sharing my process, I aim to put pressure on myself to stay focused and continually improve as a trader. If you choose to act on any of this information, you do so at your own risk, and I will not be held responsible for any outcomes. Please conduct your own research and make informed decisions.

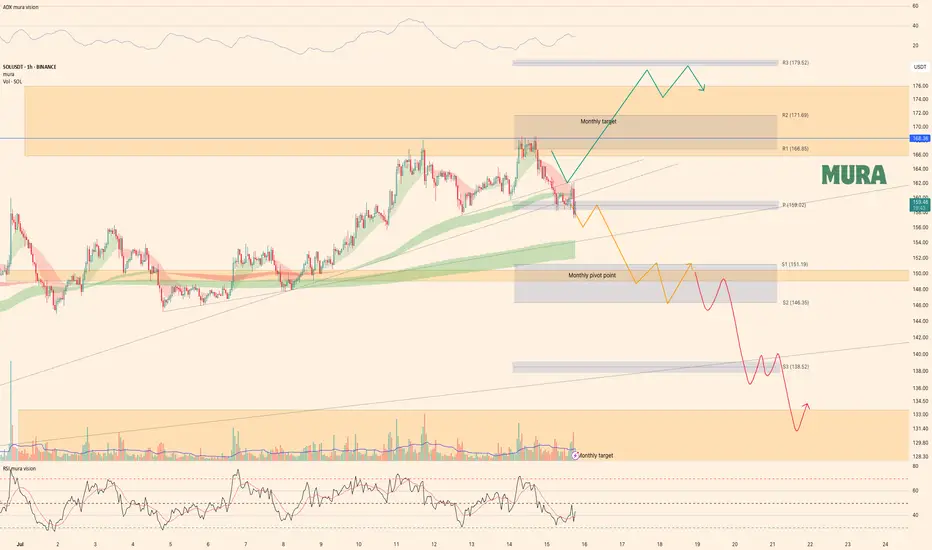
Solana - key levels for this weekSolana is currently testing the weekly pivot point and trying to break higher, but we've already seen one rejection. If it manages to hold above this level, we could see a push toward $169. However, if we get a fake breakout or fail to sustain above the weekly pivot, the nearest support target sits at $151. In that case, price would follow through with our orange scenario. More details are in yesterday's video analysis
Levels marked—now let the market decide

Solana UpdateHello friends🙌
After the price growth we had, the price hit the resistance level of $160 twice and failed to break it, which caused a double top pattern to form, which if confirmed, there is a possibility of falling to the specified areas.😉
The specified areas are good prices for buying in steps, of course, with capital and risk management.✔
🔥Join us for more signals🔥
*Trade safely with us*
Solana starting to look bullish again | Target $180 - $260In my previous idea, I anticipated a liquidity hunt below the $140 level, and price action played out exactly as expected. SOL wicked below this key support zone, triggering stop-losses and inducing panic selling — classic behavior before a major reversal. Following this sweep, price quickly reclaimed the range, breaking out of the downward channel, and is now retesting a bullish break of a textbook cup-and-handle pattern, signaling a potential trend continuation to the upside.
📊 Technical Setup
Cup and Handle formation is evident, with the "handle" forming as a downward-sloping channel now being challenged.
Price reclaimed the $140 demand zone post-sweep and is now retesting.
Target zones: $180 → $220 → $260 based on historical resistance levels and measured move projections.
📉 Invalidation Level
A daily close below $120 (marked as the Invalidation Zone) would invalidate this setup and suggest bulls have lost control.
🌐 Macro Perspective
Fed Rate Cut anticipation and cooling inflation data are helping risk-on assets like crypto regain momentum.
SOL staking ETF launching this week, while SOL spot ETF approval imminent.
Solana's growing DeFi ecosystem, along with high TPS performance and low fees, continues to attract developer and user activity. SOL remains a top candidate for sector outperformance in a bullish H2 crypto cycle.
📌 Conclusion
With market structure turning favorable and strong macro tailwinds, SOL may be gearing up for a major breakout rally. Watch the $160 level closely — a decisive break and hold above could confirm the next leg higher.

SOLANA → Pre-breakdown consolidation may lead to distributionBINANCE:SOLUSDT is declining and testing the support of the trading range as Bitcoin pauses after strong growth and enters a correction phase...
SOL looks a bit weaker than Bitcoin technically, but SOLANA has some positive fundamentals, though that might not be enough.
After forming a false breakout of key daily resistance, Bitcoin is moving into a correction phase. An update of local lows on the chart could trigger a drop across the entire cryptocurrency market.
In SOL, the focus is on the two nearest levels of 148.75 and 145.64. A breakdown of support could trigger the distribution of accumulated energy within the specified range as part of a downward momentum.
Resistance levels: 148.75, 151.2, 153.88
Support levels: 145.64, 138.59
The ideal scenario would be a false breakout of 148.75 (liquidity capture) and a retest of 145.64, followed by a break of support. Consolidation below 145.65 could trigger a drop to the zone of interest at 138.59.
Best regards, R. Linda!

SOL/USDT Technical Outlook – Breakout Holding, Eyes on 175+Solana has successfully broken above the key resistance zone at $155–157 and is currently testing it as new support. If the level holds, this breakout could extend toward the next major target around $175–178.
📌 Key Insights:
Clean breakout followed by a potential SR flip
Watch for confirmation of support before continuation
Target aligns with previous swing high
Invalidated on breakdown below reclaimed level
🟢 Bias remains bullish as long as price holds above the breakout zone. A confirmed retest could provide a high-probability long setup.
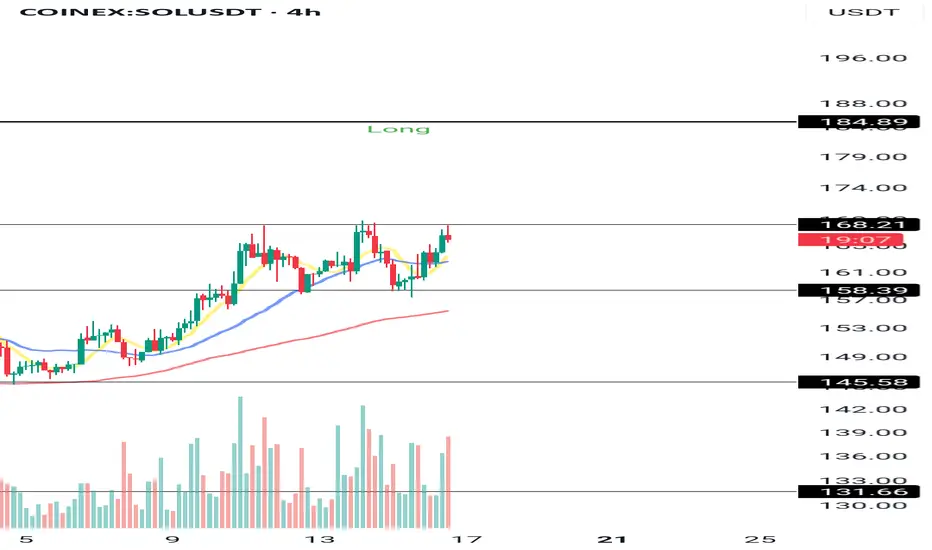
SOL/USDT – Preparing for the Next Breakout🚀 SOL/USDT – Preparing for the Next Breakout
Hey everyone 👋
Here’s a detailed look at Solana (SOL) and some key confluences across multiple charts. Let’s dive in:
---
🔹 SOL/USDT – 4H Chart
SOL is currently sitting at a very interesting level.
🔑 If we break and hold above 168.21, the path toward 185 becomes much clearer.
📍 The 185 zone is a strong level and technically a safer long, but it also comes with a higher chance of fake breakouts and chop.
That’s why — if market conditions align — I’d prefer to open a long position above 168.21, so I’m not getting trapped later at 185.
---
📈 SOL Dominance (SOL.D) – 4H
A key level here is 2.41.
If SOL.D breaks this level at the same time as SOL/USDT breaks 168.21, it acts as a strong confirmation for a long position.
---
🔁 SOL/BTC
Another useful chart for context:
✅ 0.001351 has already been broken — a good initial sign.
🔓 A breakout above 0.001424 would provide extra confirmation for a SOL/USDT long setup.
---
💰 TOTAL3 – Altcoin Market Cap (excluding BTC & ETH)
This is crucial for overall altcoin sentiment.
📍 The key level here is 965B.
If this level breaks, it signals strong capital inflow into altcoins — and likely becomes the first trigger for a SOL long position.
---
🎯 What’s the Long Setup All About?
The goal here is not to catch a move at 185 — that’s too risky due to likely fakeouts.
Instead, we want to enter earlier (at 168.21) if momentum supports it, and ride the move safely.
🛠 Plan:
Wait for a 4H candle close above 168.21
Look for volume + momentum confirmation
Use a Stop Buy order above this level to enter
This way, we’ll be in a strong position before the noise starts at 185.
---
🙏 Thanks for reading.
If you found this analysis useful, don’t forget to hit the 🚀 icon and follow for more!
#SOL/USDT Loves THIS Pattern | BULLISH#SOL
The price is moving within a descending channel on the 1-hour frame, adhering well to it, and is on its way to breaking strongly upwards and retesting it.
We have a bounce from the lower boundary of the descending channel. This support is at 143.
We have a downtrend on the RSI indicator that is about to break and retest, supporting the upside.
There is a major support area in green at 142, which represents a strong basis for the upside.
Don't forget a simple thing: ease and capital.
When you reach the first target, save some money and then change your stop-loss order to an entry order.
For inquiries, please leave a comment.
We have a trend to hold above the moving average of 100.
Entry price: 149.
First target: 153.
Second target: 156.
Third target: 159.
Don't forget a simple thing: ease and capital.
When you reach the first target, save some money and then change your stop-loss order to an entry order.
For inquiries, please leave a comment.
Thank you.
