SOLUST trade ideas

SOL formed Weekly H&S, Pump Potential Could Be HugeLast time, I shared an analysis predicting that CRYPTOCAP:SOL could drop to $131 to form the second right shoulder of a massive Head and Shoulders Bottom. (I’ve included the related publications for you to check.)
That drop has played out recently, and COINBASE:SOLUSD has hit the target.
The weekly Head and Shoulders Bottom on BINANCE:SOLUSDT looks perfect, with two dips on each shoulder and nearly identical drop sizes.
If this pattern holds, the upside potential is massive—breaking $1,000 could just be a matter of time (and that might even be a conservative target).
But, please always set a stop-loss for your trades—there are no guarantees in any scenario.
🔴 Read my signature & publications for more info you don’t want to miss.
🔥 for more future "guesses" like this!


solonaSOL/USDT faces intense bearish pressure, with no immediate signs of reversal. Traders should monitor:
Bearish Scenario: Sustained trading below 166.82 could accelerate declines toward 120.00.
Bullish Rebound: A reclaim above 180.00 (resistance) might signal short-term relief, but skepticism remains.

Playing Yearly Levels on SOL: Targeting $170I know the market looks dreadful, especially for most coins within the Solana ecosystem. However, this is simply a retest of the breakout levels and the Point of Control (POC) into the $130s.
If there’s a chance to get it cheaper around $122, I’ll place a bid, along with the last level. These are spot buys, of course.
This is all true as long as BTC stays above $75K, so keep that in mind when taking risks. If BTC decides to challenge sub-$80K territory, be cautious.
I’m not looking for new all-time highs (ATHs), but a retest around $170 would be welcomed.
CRYPTOCAP:SOL BINANCE:SOLUSDT

What happens if Solana rebounds? SOLUSDT Swing ChartSolana, alongside Ethereum, has been one of the most criticized projects during this downturn.
Issues such as Pump.fun’s reckless meme coin launches and the Trump coin controversy have fueled negative sentiment. As a result, I’ve noticed that many people are now mocking Solana along with Ethereum.
Given these factors, I analyzed Solana’s rebound potential, and I’ve observed some promising signs.
The first reason is the end of the decline due to a BSL Sweep.
I typically observe how far a drop extends when liquidity removal (Liq Sweep) occurs at the upper or lower range (BSL, SSL). Based on this, I generally assess the situation in two ways
For example, when liquidity removal occurs at BSL, I assess whether the price could drop further down to SSL.
I define the BSL-SSL zone as a single range and look for potential rebound areas around the 50% midpoint of this range.
If scenario 2 occurs, there are many aspects to consider, but to put it simply, we can look at the possibility of a rebound through the Premium Zone, a concept from ICT theory. Within this zone, we analyze various key levels.
The Premium Zone can be understood as an area where Smart Money can exit their positions once the price reverses. Just like retail traders, Smart Money must sell their positions to realize profits.
Since the short positions taken at BSL are likely to be substantial, closing these positions would reduce selling pressure. As a result, this decrease in selling pressure could lead to a price increase.
I believe that the current Solana chart has reached the Premium Zone after a retracement caused by the BSL liquidity sweep.
Additionally, I have observed a Shark Pattern, a type of Harmonic Pattern, which suggests a potential rebound scenario.
Harmonic Patterns are chart patterns based on Fibonacci ratios used in technical analysis to predict potential reversal points in price movements.
These patterns frequently appear in the market, and they are structured around specific Fibonacci retracement and extension levels. When price movements align with these ratios, a recognizable harmonic structure is formed, signaling a possible reversal.
Additionally, Harmonic Patterns generally have four key target points based on Fibonacci retracement levels:
1. When measuring between C Point and D Point using the Fibonacci retracement tool, the typical targets are:
38.2%
50.0%
61.8%
2.If the price retraces properly, it can extend further up to the D Point.
For this Shark Pattern, I currently identify the D Point at $125.52, which represents the current low. *Personally, if the price falls below this level, I believe it could drop further down to the X Point.
Regarding the C-D leg of the Harmonic Shark Pattern, the typical extension ranges between 0.886% and a maximum of 1.13%.
.
.
.
.
I always find it challenging to wrap up my analysis smoothly, but I hope this perspective provides some insight.
As always, this is just my personal opinion, so I encourage you to review it with an open mind.
Thank you!

SOL/USDT Elliott Wave AnalysisSolana is currently in a corrective phase following a significant decline from its recent highs. The chart reflects a complex Elliott Wave structure, with an ongoing ABC correction. The primary expectation is for further downside, with the final Wave C targeting the $75–$85 demand zone (highlighted in purple).
Primary Scenario (Bearish Outlook)
Wave A has completed, followed by a corrective Wave B, which saw a temporary rally.
Wave C is unfolding, with sub-waves indicating a further decline.
The structure suggests Wave v of C is yet to complete, with potential targets in the $75–$85 range.
A corrective bounce within Wave iv is expected before the final drop.
Alternative Scenario (Bullish Reversal)
If Wave C fails to break below $125, this could indicate a truncation.
A strong impulse breaking above $165–$175 could invalidate further downside and shift momentum towards a bullish recovery.
In this case, Solana could begin a new impulsive structure targeting $200+ in the coming weeks.
Key Levels to Watch:
Support: $125 (current low), $85–$75 (major demand zone)
Resistance: $165–$175 (invalidates bearish outlook)
Overall, the bias remains bearish unless we see strong momentum above $165. Until then, lower targets remain in focus.


SOLUSDT at Critical Resistance – Will Bears Take Over? Yello, Paradisers! Is SOLUSDT setting up for a major drop? The technicals are flashing warning signs, and you need to pay attention.
💎SOLUSDT has broken down rising wedge, showing a loss of bullish momentum. On top of that, a bearish divergence is appearing, and the price is currently testing key resistance at the 200 EMA—a combination that significantly increases the probability of a bearish move.
💎If SOLUSDT retests the resistance zone and the 200 EMA again, a double top formation could play out. But before jumping in, waiting for bearish confirmation is the smart move.
💎If price breaks above and closes a candle above the resistance, it will invalidate the bearish thesis. In that case, patience is key—waiting for clearer price action will be the best approach.
🎖Trading isn’t about guessing—it’s about waiting for high-probability setups and executing with discipline. Stay sharp, Paradisers, and remember: the market rewards patience, not impulsive moves.
MyCryptoParadise
iFeel the success 🌴


Will Solana Break $200, or Are Red Candles on the Way?Hello and greetings to all the crypto enthusiasts, ✌
All previous targets were nailed ✅! Now, let’s dive into a full analysis of the upcoming price potential for Solana 🔍📈.
Recent developments have sparked a sharp rally in Solana’s price, driving significant momentum within just a few hours. Based on my analysis, this bullish trend could extend further, potentially gaining another 24% and pushing the price toward the **$200 mark**. However, short-term retracements and red candles may emerge before reaching this target, as natural market fluctuations take place. Traders should remain vigilant, monitor key support levels, and manage risk accordingly. 🚀📚🙌
🧨 Our team's main opinion is: 🧨
Solana's price is surging fast and could reach **$200**, but expect some dips and market corrections along the way! 📚🎇
Give me some energy !!
✨We invest hours crafting valuable ideas, and your support means everything—feel free to ask questions in the comments! 😊💬
Cheers, Mad Whale. 🐋


SOL/USDT 2H Chart🔹 Asset: Solana (SOL/USDT Perpetual Futures)
🔹 Timeframe: 2-Hour
🔹 Exchange: MEXC
📊 Market Overview:
Solana has bounced from a key support zone after a strong breakdown, signaling a potential shift in momentum. The structure has confirmed a Break of Structure (BOS), which may lead to further upside movement before facing resistance.
📈 Key Technical Insights:
✅ Support Holding: The price has reacted well to the $130 - $135 support zone, leading to a bounce.
✅ Mini Reversal Area ($150 - $155): This zone could act as a minor resistance before a deeper retracement.
✅ Main Reversal Area ($165 - $175): A significant supply zone where selling pressure may increase.
📌 Trading Plan:
🔹 Bullish Scenario: If SOL holds above the support zone and breaks past the Mini Reversal Area ($150 - $155) with volume, a further move toward the Main Reversal Area ($165 - $175) is likely.
🔹 Bearish Scenario: If SOL struggles to break past $150 - $155, a retest of the support zone ($130 - $135) could happen.
🔹 Risk Management: Watch for rejection wicks or bearish divergence before entering short positions.
📢 Final Thoughts:
📌 A strong move above $155 could trigger further upside momentum.
📌 Traders should watch price action closely at the marked reversal areas.
📌 Be patient, wait for confirmation, and manage risk accordingly!
⚡ Trade smart and stay ahead of the market! 🚀

Solana's Flush Is Over: The Path Toward $500+ Is Now ClearThis is it!
Good afternoon my fellow Cryptocurrency trader, we are ready and live today. Solana's low has been hit.
Are you a Solana trader, buyer, holder?
Are you a Solana fan?
If yes, I have great news for you.
The low is in!
Solana's low has been hit.
Get ready for a massive bullish phase.
➖ Technical Analysis
SOLUSDT just activated a very strong support zone. This is the support zone that was created between June and October 2024. A consolidation phase that lasted more than four months and launched a bullish wave that peaked at $296.
This same support range is now being activated with a higher low, and this will lead to a new market phase, the 2025 bull-market. A higher low leading to a very strong higher high; a new All-Time High plus much more.
Easy target here is set around $379 but there is room for more, much more because we are about to experience long-term growth. First, we will have three months green, that is March, April and some May. Then likely a correction and then additional growth leading to the bull-market bull-run phase. This is a rough presentation, we will go deeper as we study together the market and the charts. Huge profits will be made.
This is fun.
This is awesome.
We are ready to trade.
Thank you for reading.
Namaste.

SOLUSDT Long by TeamPWRTradesHi Traders,
SOL Long Idea
Based on recently volume and liquidity zones our team has entered a long positions SOL. Targets are 160-175. Stoploss below daily low.
Recommended risk 1-1.5% of portfolio.
Entry 1: 136.50
Entry 2: 133
TP 1: 160
TP 2: 175
SL: 132
Happy Trading,
TeamPWR

Solana 10X Trade-Numbers (3,810% Potential)Buy when prices are low. Sell when prices are high.
Sell at resistance. Buy at support.
Solana right now is trading at long-term support. The same support range that has been active and valid since April 2024. This support was challenged many times and always holds. —Buy at resistance, sell at support.
This is a great setup, great price, great timing. Risk still exist though.
Leveraged trading is high risk and for experts only.
I am wishing great profits and good luck.
—Full trade-numbers below:
_____
LONG SOLUSDT
Leverage: 10X
Entry levels:
1) $140
2) $135
3) $130
4) $125
Targets:
1) $188
2) $195
3) $210
4) $234
5) $249
6) $273
7) $312
8) $340
9) $375
10) $477
11) $575
12) $664
Stop-loss:
Close weekly below $125
Potential profits: 3810%
Capital allocation: 5%
_____
Thanks a lot for your continued support.
Namaste.


Solana: Intra-week Setup Locked In I’m targeting an intra-week play on Solana, but staying cautious. That’s why I’m using a tighter stop-loss and placing my entry slightly lower. Still, this is a strong level for me because multiple key factors are lining up.
We have the midpoint of the 30-minute Fair Value Gap, an untouched VWAP (which I’ve hidden to avoid clutter), the VAL from VWAP (Volume Area Low), and a huge liquidity zone above the Previous Weekly High, including an order block – acting as a potential magnet.
On the 30-minute time frame, the RSI is trending further into oversold territory, adding more confluence to the setup. Lower time frames are still looking bullish, as long as we hold this level. If not, things could get messy. But until then, everything looks solid.

SOL/USDT – Double Zigzag Completed! Is a Bullish Reversal Next?Solana (SOL) has likely completed a Double Zigzag (WXY) correction, with Wave C of Y bottoming at $130.60 (1.0 Fibonacci extension). This suggests a potential trend reversal, but SOL must first break key resistance at $146-$150 to confirm a bullish move.
🔹 Elliott Wave Analysis & Bullish Scenario
If the Double Zigzag correction is complete, SOL could begin a new impulse wave, targeting:
✅ $169-$173 (0.5 Fibonacci retracement, previous Wave B resistance)
✅ $180-$195 (0.382 Fib & major supply zone)
✅ $220+ (Wave 3 extension target)
🔻 Bearish Scenario – Extended Correction?
If SOL fails to break $150, it could indicate that the correction is not yet over, leading to:
❌ Retesting $130 support
❌ Possible extended correction towards $113-$100 (1.272 Fib extension)
📌 Key Level to Watch:
🔹 A break & close above $150 signals bullish continuation.
🔹 A rejection could mean further downside.
📊 Is SOL ready for a breakout, or will we see another leg down? Share your thoughts below! 👇🔥


Solana Reverses Downtrend: Trump's View on Crypto and What Next.Solana Breaks Downtrend Line: Trump’s Crypto Stance and Key Resistance at $180
Solana has recently broken the downtrend line on its daily timeframe, which has garnered significant attention in the crypto market. This shift in momentum comes amidst former President Donald Trump’s comments on cryptocurrencies, where he named XRP, Solana, and Cardano as potential candidates for a U.S. crypto reserve. His statements have sparked renewed interest in these assets, pushing their value upward.
Currently, Solana is facing resistance at the $180.00 level. For traders looking to enter a long position, it’s crucial to wait for a breakout above this key resistance. Confirming the breakout would require the price to close above the $180 level in a 4-hour timeframe. Until then, caution is advised, as the market continues to test this critical threshold.
Traders should monitor the situation closely for any signs of a breakout or rejection at the $180 level. If Solana manages to close above this level, it could signal the next phase of its upward momentum, with potential for further gains. However, patience is essential to ensure the breakout is confirmed before entering any long positions.

sol FINISHED"The Pump Fun casino was exciting, peaking with the 'Trump top,' which drove many investors to buy SOL in droves to join the action. But the jig is up—memecoins are a thing of the past. We’re now in a meme cooldown period as people realize they aren’t winning the game. There’s little reason to buy SOL at this point, especially with many holders and upcoming unlocks creating sell pressure. The only hope is the SOL ETF, but holders are in for a rude awakening when it fails to attract inflows, even if it gets approved. I expect we’ll see prices drop below $100 again

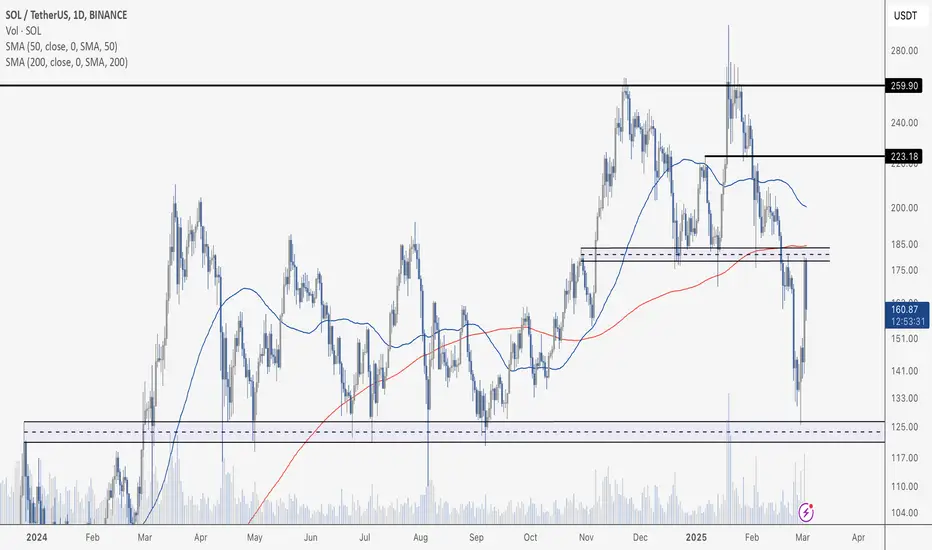
Solana Goes Level To LevelSolana's daily chart shows a strong bounce from key support around $125, leading to a sharp rally that topped out near $180, right at a critical resistance level. This area also aligns with previous price structure and the 200-day moving average (red line), reinforcing its importance.
The rejection at $180 indicates that sellers stepped in at a well-defined level, preventing further upside for now. To confirm a breakout, SOL needs to flip this resistance into support. Otherwise, failure to reclaim this level could lead to another pullback, potentially toward the mid-range of the recent move.
Volume on the recovery was notable, showing strong buyer interest, but follow-through will be crucial. Bulls will want to see consolidation and another push higher rather than a swift rejection back toward lower levels.