$SOLCRYPTOCAP:SOL
$156.5 - $150 fantastic area to bid for higher targets, expecting big moves in the future from SOL so will be looking to add to my bags here.
SOLUST trade ideas

solusdt is dangersHello, I will say briefly that Solana will be scammed like Lana
I hope your analysis is not correct

Sell Short On salana!I delay to enter the main Trigger
But Sell short finally...
Lets see my Target around 163!

Short On Solana!I delay to enter the main Trigger
But Sell short finally...
Lets see my Target around 163!

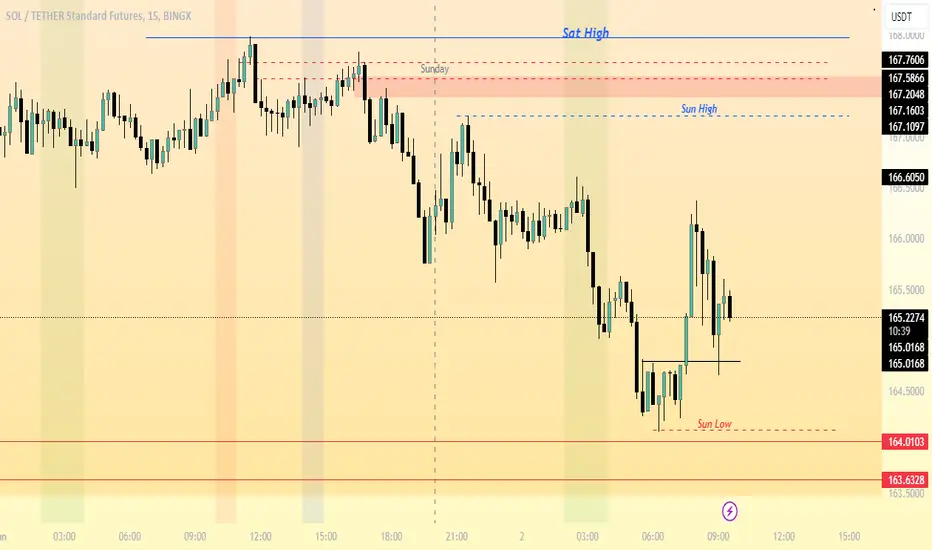
What Solana Do on Sunday?Lets see whats move today!
Do Break the Sunday High or Saturday High?
Can Get Short Position on NY session or Pm Session?
I am looking for short Position!
You?

Solana Has no Weekend?Solana was resting yesterday!
Lets see whats move today!
Do Break the Sunday High or Saturday High?
Can Get Short Position on NY session or Pm Session?
I am looking for short Position!
You?
SOLUSDT TM : 1hHello traders.
I hope you doing well.
These areas are based on my personal strategy and I will share it with you.
Open a sell position on the supply area or open a buy position on the demand area.
Your entry point, stop loss, and target point are based on money management and the amount of money in your trading account.
But I promise you that by trading in the areas of my trading strategy, you will definitely make a profit, because these areas, although they seem simple, are my experience of 8 years of learning and trading.
I hope you will achieve maximum continuous profit with me by using supply and demand areas.
Good luck traders.
Mohammad Goodarzi

Bullish Continuation Pattern Signals Over 20% Upside Potential?Hi Realistic Traders, let's delve into the technical analysis of BINANCE:SOLUSDT
On the Daily timeframe, the price has ascended above the EMA200 line, signifying a robust bullish trend. Recently, it has formed a bullish chart pattern (symmetrical triangle) and breached the upper trendline. Such a breakout typically indicates the continuation of a bullish trend. Furthermore, the MACD histogram transitioned from the negative zone to the positive zone, further endorsing the potential upward movement toward our first target at 185.72. Subsequently, the price may revisit the pullback zone before establishing a new high and achieving the second target at 227.21.
It is essential to note that the analysis will no longer hold validity once the target/support area is reached.
Disclaimer:
"Please note that this analysis is solely for educational purposes and should not be considered a recommendation to take a long or short position on SOLUSDT."
Please support the channel by engaging with the content, using the rocket button, and sharing your opinions in the comments below

SOLUSDT In WarHey traders
As u can see, SOL formed a fire fox pattern ( also known as hell dog ) in 4H n Daily TF
according to the pattern, we can expect another sell pressure to the lower demand zone same as the chart
if you wonder whats next, its ez , LAMBOOOOO
! its not a financial advice !
DYOS

SOLHello guys
Another simple analysis from me
For analysing any chart
We need 3 parameters
Directions
Zone
Confirmation
Here we see nice up trend
Our zone has chosen by Sam sidean method
My Confirmation is from stev Neisson method
One fact is important
If u want get short term trade ; even you need analysis H4 Time frame for parameters 1
Then use zone and Confirmation from your Confirmation time frame
Even u can use third time frame for Confirmation

SolusdtHello dear followers and traders,
today we will review Solana cryptocurrency together. Solana is a digital currency that is well-known in global financial markets. This currency utilizes blockchain technology and is coded based on complex algorithms. Solana serves as a financial tool for conducting transactions and transferring digital currencies.
If you are looking for a high-profit and excellent cryptocurrency, Solana might be a suitable option.
Analyzer of financial markets, forex, cryptocurrency, in a simple and fluent style
#Smartmoneyconcept
#Liquidity
#currencyhunter

Abuy market overall bullish , internal liquidity cleared , engineered liquidity formed , no hidden resistance, the buy is highly probable

Price Action Reversed!In NY session, Price action hint the Sell side and go through the Pool of liquidity.
Then Must back to up!

Time To Long Position!In NY session, Price action hint the Sell side and go through the Pool of liquidity.
Then Must back to up!


SOL: Where to take some profitsThe price is currently facing significant resistance at the current price level, and if a breakthrough is successful, a move to 160$ will likely happen!
In this setup, I've highlighted three price levels where it is wise to take some profits if you buy at 146 $!
The idea is: Buy when the price breaks above 146$ and take profits at the levels shown in the chart.
Targets:
1. 160$
2. 195$
3. 258$
-------------------------------------------
About our trades:
Our success rate is notably high, with 10 out of 11 posted trade setups achieving at least their first target upon a breakout price breach (The most on TW!). Our TradingView page serves as a testament to this claim, and we invite you to verify it!

Solana (SOL): Gameplan We Wait For = Selling ScenarioSolana is moving nicely after forming that local top near $188.
Ever since, the price has moved smoothly to lower zones, testing the EMAs and still pressing the zone there.
We are waiting for a clean breakdown from there and a potential movement to the lower support zone (or at least movement towards it).
Swallow Team

SOL: Pullback in UptrendTrade setup : Price is in an Uptrend. Pullback near $160 support and long-term up trendline ($143) could be an attractive swing trend entry in Uptrend, with +25% upside to $200. Stop Loss (SL) level at $140.
Pattern : Pullback in Uptrend . Price remains in an Uptrend but has pulled back, which could present a 'buying dip' opportunity. Traders should look for the nearest support level where price could stabilize and resume its Uptrend. This support level could be a level where price bounced off of in the past, or a level that was previously resistance. (concept known as polarity).Learn to trade key levels in Lesson 3.
Trend : Short-term trend is Up, Medium-term trend is Strong Up and Long-term trend is Strong Up.
Momentum : Price is neither overbought nor oversold currently, based on RSI-14 levels (RSI > 30 and RSI < 70).
Support and Resistance : Nearest Support Zone is $160.00, then $125.00. Nearest Resistance Zone is $200.00.

Sol / TetherUS _ Distribution price _ For 1st _ Week _ June. Sol / TetherUS _ Distribution price _ For 1st _ Week _ June.
Distribution price = $208.63
Market will take few weeks break from here for purpose of repeat cycle and expecting the drop to the level of $124.78

Solana (SOL): Will it Rebound Back to $170 or Slip Down to $150?With the resurgence of memecoin mania, Solana also received significant momentum. The bulls used all their strength to keep the value above $180 but the growing bearish strength caused a notable pullback. As a result, the SOL price is consolidating strongly within a narrow range of $163 to $172, indicating the possibility of a large move ahead.
While the crypto markets have been outpowered by the bears, can the SOL price initiate a fresh upswing to nullify the selling pressure?
Ever since the start of the rally in March, the SOL price has demonstrated its strength by marking highs above $200 a couple of times. However, a rejection followed, causing a 40% loss in value. Regardless of this, the current trade set-up suggests the bulls to be holding a tight grip over the rally and hence demonstrate a higher possibility of reclaiming $180 in the first few days of June.
As suggested in the above chart, the SOL price continues its trade within a symmetrical triangle and is currently holding above the local support zone between $155 and $160. The tight accumulation has occurred due to the equal participation of the bulls and bears and hence this suggests a huge price action could be on the horizon.
Besides, the technicals suggest a notable change in the trend as the Gaussian channel just turned green, indicating the beginning of an upswing. Moreover, the price is closely ranging just below the upper bands of the channel and if they manage to break above the levels, a fresh upswing may begin. Secondly, the stochastic RSI has also reached below the lower threshold and could be preparing for a rebound, substantiating the bullish claim.
Therefore, Solana’s (SOL) price continues to remain within bullish influence and hence a bullish breakout above $175 may be expected at the beginning of the second half of 2024.
WHITEBIT:SOLUSDT

Short on Solana!I should took the position from the entry point of 171... BUT I MISSED!
Lets see is it hont my TP? maybe will be 160 or 150?

Is it going to 152?I should took the position from the entry point of 171... BUT I MISSED!
Lets see is it hont my TP?
