SOLUST trade ideas


HolderStat┆SOLUSD aims for the $170 levelBINANCE:SOLUSDT has broken above triangle resistance, retesting the $146.60 level as new support. The breakout echoes earlier consolidation-based rallies, opening the path toward $170. As long as the structure remains intact, bulls could extend the climb over the next few sessions.


DeGRAM | SOLUSD seeks to confirm the breakout📊 Technical Analysis
● Bulls pushed back inside the broad rising channel and pierced the five-week gray trend-cap; the breakout has been retested at the 147-150 pivot (green strip), now acting as support.
● Price is carving a tight bull-flag on diminishing volume; its 1.618 swing and the channel median intersect with the May swing high near 173, while the upper rail aligns with 187-190.
💡 Fundamental Analysis
● VanEck’s late-June 19b-4 filing for a US spot Solana ETF trimmed perceived regulatory risk, and Firedancer’s public test-net timeline lifted developer sentiment, both fuelling fresh inflows.
✨ Summary
Long 147-150; flag break above 155 targets 173 → 187. Invalidate on a 16 h close below 140.
-------------------
Share your opinion in the comments and support the idea with a like. Thanks for your support!

The price can reach $160-170 and then drop to $80-90.The price can reach $160-170 and then drop to $80-90.
If you want to invest, this is not a good place to enter.
It is a downtrend.
Please do not buy on the downtrend.
you must think to Short in downtrends.
Let it go lower and buy when change to bullish.

SOLANA I Daily CLS I KL - BRK I Model 1I Target TRCHey, Market Warriors, here is another outlook on this instrument
If you’ve been following me, you already know every setup you see is built around a CLS Footprint, a Key Level, Liquidity and a specific execution model.
If you haven't followed me yet, start now.
My trading system is completely mechanical — designed to remove emotions, opinions, and impulsive decisions. No messy diagonal lines. No random drawings. Just clarity, structure, and execution.
🧩 What is CLS?
CLS is real smart money — the combined power of major investment banks and central banks moving over 6.5 trillion dollars a day. Understanding their operations is key to markets.
✅ Understanding the behavior of CLS allows you to position yourself with the giants during the market manipulations — leading to buying lows and selling highs - cleaner entries, clearer exits, and consistent profits.
📍 Model 1
is right after the manipulation of the CLS candle when CIOD occurs, and we are targeting 50% of the CLS range. H4 CLS ranges supported by HTF go straight to the opposing range.
"Adapt what is useful, reject what is useless, and add what is specifically your own."
— David Perk aka Dave FX Hunter ⚔️
👍 Hit like if you find this analysis helpful, and don't hesitate to comment with your opinions, charts or any questions.

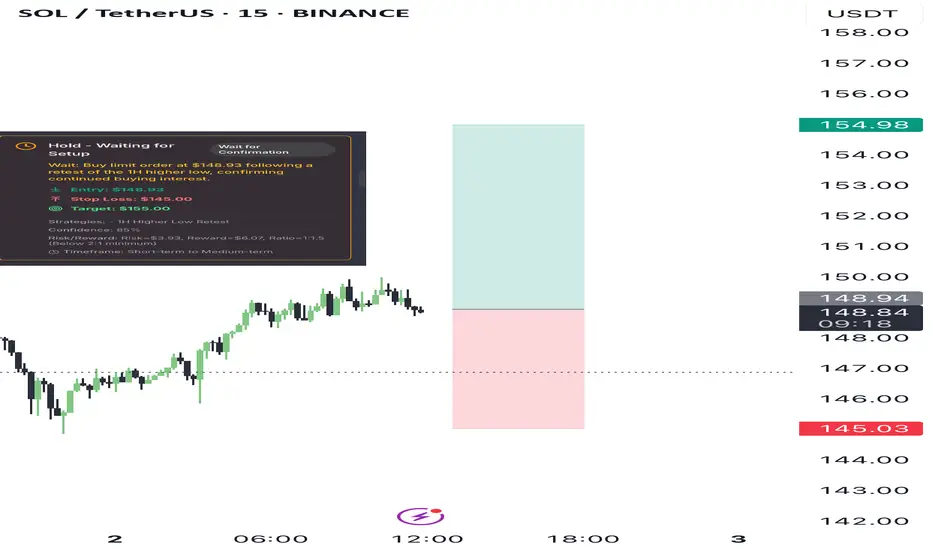
Long setup TiqGPT analysisAnalyzing the SOL/USDT across multiple timeframes, we observe a complex interplay of institutional activities. Starting from the 1D chart, the price action shows a recent recovery from a significant drop, suggesting a potential phase of accumulation or re-accumulation by institutions. The 4H and 1H charts display a series of higher lows, indicating a short-term bullish sentiment and possible preparation for an upward move.
The 15M, 5M, and 1M charts reveal more granular details of this bullish sentiment, with price action forming higher lows and testing previous highs, which could be indicative of a buildup of buying pressure. The presence of wicks on the lower side of candles in these lower timeframes suggests rejection of lower prices, a typical sign of institutional buying interest at those levels.
INSTITUTIONAL THESIS:
Institutions appear to be in a phase of accumulation, particularly noticeable on the 1D and 4H charts where the price has stabilized and started to curve upwards. The higher lows across the 1H, 15M, and 5M charts support this thesis, indicating an ongoing demand at higher price levels. This setup suggests a preparation for a potential upward breakout.
LEARNING POINT:
"1H and 4H higher lows formation amidst a broader 1D accumulation phase."
SIGNAL: WAIT
SYMBOL: SOL/USDT
ENTRY PRICE: $148.93
STOP LOSS: $145.00
TARGET PRICE: $155.00
CONDITION: Buy limit order at $148.93 following a retest of the 1H higher low, confirming continued buying interest.
RATIONALE: Calculated risk/reward ratio of 1:1.5 (Risk=$3.93, Reward=$6.07) does not meet minimum 2:1 requirement. Waiting for better institutional setup with improved risk parameters.
Momentum & Exhaustion: Rejection of lower prices on lower timeframes, indicating exhaustion of selling pressure.
Liquidity Behavior: Potential liquidity above recent highs around $150.00, likely target for institutional profit-taking.
Pressure Analysis: Institutional buying evident from wick rejections on lower timeframes.
Context Awareness: Price action moving from a discount (recent lows) towards a premium zone (above $150.00).
STRATEGIES USED:
1H Higher Low Retest
4H Accumulation Phase Buying
Targeting Liquidity above $150.00
Weekly trading plan for Solana Last week, BINANCE:SOLUSDT price followed our bullish (green) scenario perfectly and hit the first target. At this point, the upward corrective phase may be complete, so we could reasonably expect a pullback to either the weekly pivot point or support zone
Write a comment with your coins & hit the like button and I will make an analysis for you
The author's opinion may differ from yours,
Consider your risks.
Wish you successful trades ! mura

Solana starting to look bullish again | Target $180 - $260In my previous idea, I anticipated a liquidity hunt below the $140 level, and price action played out exactly as expected. SOL wicked below this key support zone, triggering stop-losses and inducing panic selling — classic behavior before a major reversal. Following this sweep, price quickly reclaimed the range, breaking out of the downward channel, and is now retesting a bullish break of a textbook cup-and-handle pattern, signaling a potential trend continuation to the upside.
📊 Technical Setup
Cup and Handle formation is evident, with the "handle" forming as a downward-sloping channel now being challenged.
Price reclaimed the $140 demand zone post-sweep and is now retesting.
Target zones: $180 → $220 → $260 based on historical resistance levels and measured move projections.
📉 Invalidation Level
A daily close below $120 (marked as the Invalidation Zone) would invalidate this setup and suggest bulls have lost control.
🌐 Macro Perspective
Fed Rate Cut anticipation and cooling inflation data are helping risk-on assets like crypto regain momentum.
SOL staking ETF launching this week, while SOL spot ETF approval imminent.
Solana's growing DeFi ecosystem, along with high TPS performance and low fees, continues to attract developer and user activity. SOL remains a top candidate for sector outperformance in a bullish H2 crypto cycle.
📌 Conclusion
With market structure turning favorable and strong macro tailwinds, SOL may be gearing up for a major breakout rally. Watch the $160 level closely — a decisive break and hold above could confirm the next leg higher.


Analisis SOLANA🔍 SOL/USDT Technical Analysis (4H)
📆 June 30, 2025
📈 Binance | 4-Hour Chart
📊 Current Context:
Solana (SOL) is currently trading around $150, consolidating within a sideways range after a prolonged corrective phase. Price action has reacted several times around key horizontal resistance levels and Fibonacci retracements, indicating a strong battle between buyers and sellers at this zone.
📍 Key Technical Levels:
$144.94: Critical support level that has served as a base multiple times since May.
$152.49 – $160.03: Immediate resistance zone. Price has been rejected here several times and is currently retesting from below.
$179.77: Major resistance ahead, aligning with the 200-day moving average and a strong psychological barrier.
$128.39: Key lower support in case of a bearish breakdown.
📐 Additional Technical Insights:
Price action is developing within an emerging bullish channel since the May lows.
Fibonacci extensions project a potential target around $300 if SOL can break and hold above $180, a move that would likely require strong volume and external catalysts (such as the already-approved SOL ETF).
Volume remains steady, with no signs of capitulation or clear institutional accumulation in this timeframe yet.
📌 Conclusion:
SOL is showing accumulation patterns, pressing against increasingly tight resistance zones. A confirmed breakout above $160 could open the door to the $180–$190 range, a key technical target supported by confluences such as the 200-SMA, prior structure, and psychological relevance.
Meanwhile, $145 and $128 remain critical support levels to watch in case of bearish rejection. The upcoming launch of the SOL ETF could act as a major catalyst, but the market is still waiting for a technical confirmation.

Is SOLANA SOL Ready for a Breakout? Bounce from Falling Channel?
🔍 Chart Pattern and Price Structure Analysis
This chart illustrates a well-formed descending channel (parallel falling channel) that has been developing since mid-January 2025. Currently, the price is approaching the upper boundary of this channel — a key decision area.
🟡 Technical Pattern
Descending Channel: This pattern is characterized by a series of lower highs and lower lows, representing a medium-term bearish trend.
The price is now testing the upper resistance of this channel, a crucial point that could either trigger a breakout or result in another rejection.
📈 Bullish Scenario
If the price successfully breaks out above the upper trendline (around $152–$154), several resistance targets come into play:
1. $164.5 — A minor horizontal resistance and key psychological level.
2. $182.2 — A strong historical resistance zone.
3. $210–$217.8 — A previous consolidation/resistance zone.
4. $237.7, then $261–$280 — Key bullish targets if momentum sustains.
5. Ultimate target near $295.1–$295.7 if broader market sentiment remains strong.
📌 Bullish Confirmation:
Valid daily candle breakout above the channel.
Strong breakout volume.
Successful retest of the breakout area as new support.
📉 Bearish Scenario
If the price fails to break above the channel and gets rejected, we may see a continuation of the downtrend with potential moves to these support levels:
1. $140–$138 — Current minor support zone.
2. $128 — Recent consolidation support.
3. $115.5 — Major support from April.
4. $95.2 — The lowest support zone on the chart.
📌 Bearish Confirmation:
Strong rejection candle (e.g., bearish engulfing) from upper channel.
Weak breakout attempt with declining volume.
Break below the lower channel support or creation of a new lower low.
📊 Conclusion
The current setup is a classic descending channel, indicating a strong mid-term bearish structure.
Price is now at a make-or-break zone — a breakout could signal a trend reversal, while a rejection could extend the current downtrend.
Traders should wait for a confirmed breakout or clear rejection before entering a position.
#SOLUSDT #Solana #CryptoAnalysis #TechnicalAnalysis #DescendingChannel #BreakoutAlert #CryptoTrading #BullishScenario #BearishScenario #Altcoins #CryptoTA


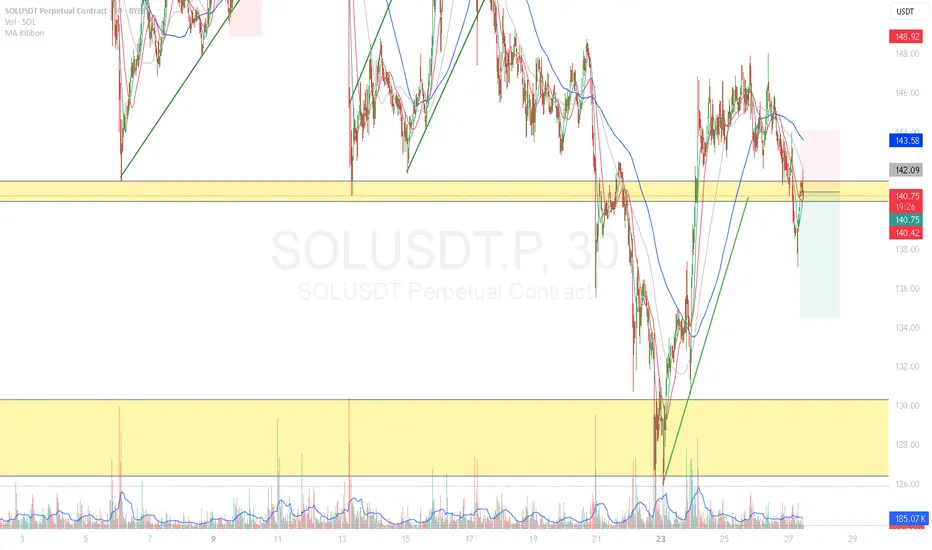
DeGRAM | SOLUSD retest of the 136 level📊 Technical Analysis
● Price bounced at 136 where the rising-channel base meets a long-held internal trend-line, locking in a higher-low and printing bullish RSI divergence.
● A micro falling-wedge is fading; clearance of the wedge roof/150 round turns bias up toward the 158.8 horizontal pivot and the channel mid-band near 187.4.
💡 Fundamental Analysis
● Solana’s daily active wallets and DEX volume have risen ~20 % since 20 Jun as new DeFi incentive programs (Jupiter, Pyth, Kamino) go live, hinting at returning user demand despite broader crypto lethargy.
Summary
Buy 137-145; confirmed break above 150 targets 158.8 → 187.4. Long thesis voided on a 16 h close below 130.
-------------------
Share your opinion in the comments and support the idea with a like. Thanks for your support!


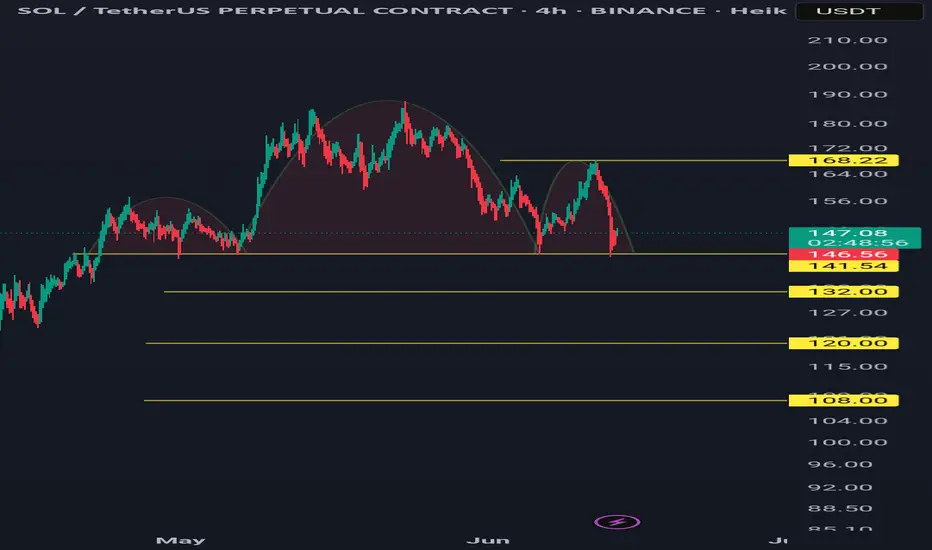
sol usdt pattern identified inverse head and shoulders with chan🧠 Technical Analysis (SOL/USDT – 4H Timeframe)
🔍 Pattern Identified: Inverse Head & Shoulders
Left Shoulder: Around $137
Head: Dipped to ~$126
Right Shoulder: Formed around $135
Neckline Breakout: Successfully broken near $148–$150 zone
This classic bullish reversal pattern indicates a potential trend shift from bearish to bullish.
📈 Trend & Channel
The price was previously trading inside a descending parallel channel (marked in yellow).
The breakout from the upper channel boundary confirms strength and momentum shift.
🚀 Price Targets (Resistance Levels Ahead):
$158.36 – First resistance level (short-term target)
$168.52 – Mid-level resistance (medium-term)
$187.56 – Key resistance (long-term target area)
✅ Bullish Confirmation:
Breakout with volume from both descending channel and head & shoulders neckline
Price holding above neckline now acting as support
⚠️ Risk Note:
A retest of the breakout zone ($148–$150) can occur before moving higher
Invalid if SOL drops back below neckline and fails to hold above $145 support zone

bitcoin update right so this is what im seeing, the chart showing right now
a pullback to 102800 approx is absolute for a healthy change in trend. this pullback is backed by 3 points,
1 no such volume in the pole and flag pattern breakout
2 liquidity which works as a magnet is more in down, market will eventually make a new ATH but it wont make that ath until grabbing all the liquidity and leaving retailers in fear.
3 we're at a good strong resistance and the daily close today was showing sign of weakness and possible change in trend.
a short with sl above 109000 can be done,
wont short eth but i have some alts in mind with some scalp short chances
ethfi, cake, aave, link. trading in alts are risky so make your own judgement, im no financial advisor
thanks