$SOL Long - 200 DMA Confluencein bull markets, we bid the 200 DMA (daily moving average) support
not making this more complicated than it needs to be
200 DMA
HTF support
prior res/support ~$110-$130
CRYPTOCAP:SOL fractal consolidation from 2021 summer
gl hf, NFA <3
- @CryptoCurb
SOLUST trade ideas

Solana (SOL): Preparing for Further CorrectionsInitially, we entered Solana at $80 and have been pleased with our position. However, upon reevaluating our scenario, we believe that the larger Wave II may not be complete, and we could see further downside. Therefore, we have decided to adjust our stop loss to avoid being prematurely stopped out, especially if Wave II is not yet finished. This adjustment is based on our long-term belief in Solana's potential.
We anticipate that Solana might fall to the range between $92 and $51, with $51 being the absolute maximum downside level. In anticipation of further corrections, we plan to place a second entry at the 127.2% Wave C level, expecting a significant rise post-correction.
Quarterly VWAP Analysis
In the current situation, the 2024 Q1 VAH (Volume Area High) is acting as resistance, while the current range is defined by the 2024 Q1 VWAP at $126, which has been touched twice, each time forming lower lows. If Solana loses the $126 support level, the next significant range is between $91 and $82. This aligns well with our second entry target at the 2024 Q1 VAH and the 2023 Q4 VAH. In the worst case, a further drop could take Solana down to around $60.
To achieve a bullish reversal, Solana needs to reclaim the $126 level and push upwards. Breaking above $161.9 would signal strength, and surpassing the $210 mark would confirm a bullish trend continuation.
In conclusion, we remain open to further downside to the $91-$82 range for a potential second entry. Holding this range is crucial to avoid deeper declines towards $60. Conversely, reclaiming $126 and breaking above $161.9, and eventually $210, would indicate a strong bullish reversal.

$SOL - Daily Support Zone #SOL Perpetual - Long
Looking for an upward retracement off the Daily Support Zone.

SOL Bullish Structure Break - Long - SOL with a structure break to the upside on the H4
- Providing a pretty clean long setup with bitcoin potentially bouncing as well.
- This Trade could provide a nice 2 R.

SOL SOL mitigated this orderblock (1) and moved down. Currently facing order block (a). This order block (a) was small resistance zone. If this zone was fail, SOL moving upside.
Order block (2&3) was next support zone.

SOL - Breakdown CompleteFrom our predicted breakdown target of Solana from $170 to $120 was just completed.
We came within $2 of our predicted bottom for Solana that we made a couple weeks ago!
As long as Solana doesn't flip the $140-150 level into new resistance then we should expect continued upwards price action towards new all time highs.

SOLUSDT - ShortSol Usdt and the entire eco looks bearish for now.
Will be looking for shorts on a retest along the trendline with a close SL.

$SOL chart weaknessThis bearish shoulder head pattern is very dangerous unless it invalidates by price action on #solana #sol chart. Not financial advice.

Solana, Short Position!Yesterday I presented 3 scenarios, and the third one was done (it was in the afternoon of yesterday, not in the morning, New York time).
But I took a long position around 11. However, my position was closed with profit and it took about 1.5 hours.
In general, it was wrong because it was against the weekly and even daily downward movement. And it caused a lot of stress. And on the other hand, I lost the afternoon shorts position.
For today (until this moment when I observed the price action of the price), I will present a scenario.
I hope this is the best position of the shorts.
I give a high probability that the movement will be sharp and fast downward.
Good luck.
Thu 20 Jun - 08:25

SOLUSD longsolana seems very oversold, especially in the light of its potential, it could be worth building long positions from current levels.

SOLUSDT.1DAnalyzing the SOL/USDT chart, we notice a few key technical elements that provide insights into the market's current dynamics and potential future movements.
Key Observations:
Current Price and Movement:
SOL/USDT is trading at $133.83, marking a decline of 1.32% today. This movement places SOL near an important support level.
Support and Resistance Levels:
R1 (Resistance Level 1): $193.09 - This level represents a significant barrier that SOL would need to overcome to confirm a bullish trend.
S1 (Support Level 1): $116.96 - Positioned as the first major support, holding above this could be crucial for maintaining a bullish outlook.
S2 (Support Level 2): $92.78 - A critical lower support, indicating deeper market corrections if S1 fails.
Technical Indicators:
MACD (Moving Average Convergence Divergence): The MACD is below its signal line, indicating bearish momentum.
RSI (Relative Strength Index): The RSI is at 40.73, close to entering the oversold territory, which might indicate a potential for price stabilization or reversal if it dips further.
Analysis and Conclusion:
The SOL/USDT pair is currently in a delicate position, hovering just above a crucial support level at $116.96. The recent price decline and the bearish MACD suggest that the market is under some pressure. However, the proximity of the RSI to oversold conditions could imply that a bounce back may occur if the support holds strong, potentially driving the price toward R1 at $193.09.
The strategy for traders in this scenario should be to closely monitor the $116.96 support level. A sustained break below this level could trigger further declines toward S2 at $92.78, while a rebound from this support could offer a buying opportunity with targets at higher resistance levels.
For now, it's advisable to watch for any bullish signals, such as a positive crossover in the MACD or a rebound in the RSI from oversold levels, which could suggest an impending recovery. Conversely, continued weakness in these indicators might suggest extending the bearish outlook.
In summary, SOL's market dynamics suggest a testing time ahead. Traders should remain vigilant, monitor key technical levels closely, and be prepared to adjust their positions based on price action and indicator signals. Always consider using stop-loss orders to manage risks effectively in this volatile market environment.

SOL 4H Potential Upside 15-27%Trade Idea: Short Solana (SOL/USDT)
Current Price: $138.07
Trend Analysis:
- The chart shows a downtrend with a descending trendline channel marked in red.
- There is a potential continuation of the downward movement as the price is respecting the descending trendline channel.
Support and Resistance:
- Immediate support levels are indicated by the green dotted line below the current price.
- Immediate resistance is marked by the red dotted line above the current price.
Trade Execution:
1. Entry:
- Enter a short position near the current price level of $138.07, ideally at the trendline or slightly above it if the price retests the trendline and gets rejected.
2. Stop Loss:
- Place a stop loss just above the trendline to minimize risk, around $140.00 to $141.00, depending on your risk tolerance.
3. Target Levels:
- Primary Target: The next significant support level as indicated by the lower green dotted line, around $135.00.
- Secondary Target: If the downward momentum continues, the price may reach the lower blue box region, which could be around $130.00.
Risk Management:
- Ensure the risk-to-reward ratio is favorable, ideally 1:2 or better.
- Adjust the position size to limit the risk to a comfortable percentage of your trading capital, typically 1-2%.
Technical Indicators:
- Monitor volume to confirm the strength of the downward move.
- Use additional indicators like RSI or MACD for further confirmation of the trade setup and potential overbought/oversold conditions.
Note:
- Continuously monitor the trade and adjust stop loss and targets as needed based on market conditions.
- Be aware of any fundamental news or events that could impact the price of Solana.
This trade idea assumes that the downtrend will continue, and the price will respect the descending trendline channel while moving towards the next support levels.

Solana, May Short on NY Session!? (Scenario 2)As shown in chart, May we have such situation!
And Then we get a Short Position!
Good Luck
Wed 19 Jun -

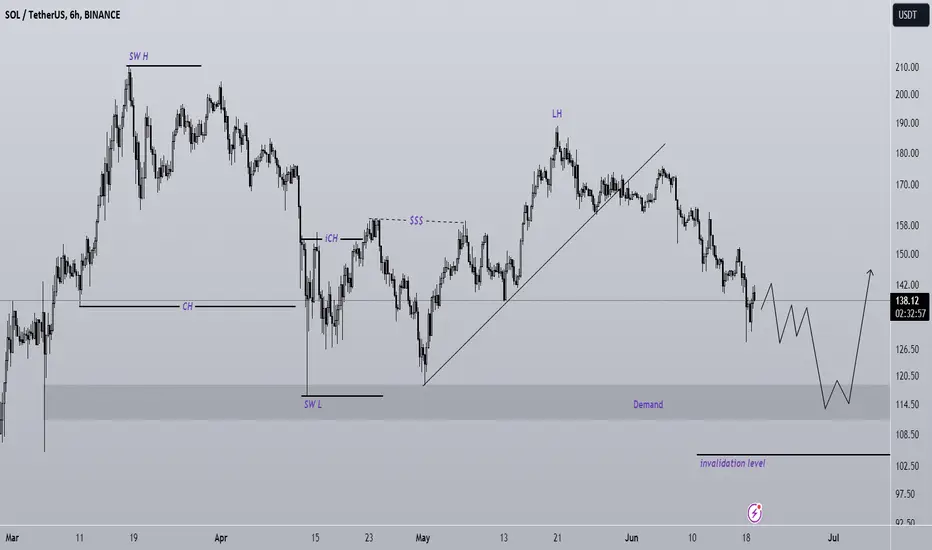
SOL buy setupThe sol symbol is now inside a correction.
It has a good support range ahead that it can react well to.
We will look for buy/long positions on the green range.
Closing a daily candle below the invalidation level will violate the analysis.
Note that the financial market is risky, so:
Do not enter any position without confirmation and trigger.
Do not enter a position without setting a stop.
Do not enter a position without capital management.
When we reach the first TP, save some profit and try to move the stop continuously in the direction of your profit.
If you have any comments please post them, comments will help us improve our performance
Thanks
Solana SOL to $500 soon! very basic but large cup and handle for Solana. chart shows a nice symmetrical trialgle or bull flag, either way, up is most likely, if Sol closes here or higher by weeks end. thn clone measured moves show the range to expect, first the triangle breakout, could go up an bach down one moe time, then blast off to cup and handle to measured move of $512 lets come back in a month and see what plays out, if trading dont buy first breakout, wait for conf, retest, not financial advice


SOL TRDAE IDEASol trade setup is very simple and clean. Take sell side liquidity, fill our Demand Zone and lets go towards moon.

Alikze »» SOL |Corrective leg C scenario🔍 Technical analysis: Corrective leg C scenario
- In the weekly time frame, wave 5 continued up to the 2.618 Fibo area.
-After that, it entered a combined cycle correction. According to the selling pressure candle in the supply area in time 1W, it can be considered that the upward corrective wave B has ended.
- In the analysis of the previous post, the details of the corrections in the weekly time frame have been reviewed.
- After the instability above the PRZ zone, the correction extended to the green box and the size of the Fibo 1.618 of the previous wave.
Due to the completion of the short-term structural reform, this demand can extend to the supply area after retesting the areas.
Therefore, any upward correction will continue until it breaks the supply zone and can retest the second green box of the liquidity zone.
- If this correction ends flat or if wave C is completed higher than wave A, the correction process can end.
- Otherwise, the minimum correction will continue up to the $100 range.
💎 Possible scenario: we should witness an upward correction, and if the supply zone does not break, after that, it should be faced with selling pressure, which can extend and stretch the correction leg C to the $100 range.
💎 In addition, if the supply area of break and above stabilizes, the bearish scenario ends and needs to be re-examined and updated.
🛑 Resistances: 150 - 163 - 175
🟩 Support: 100-113-125
»»»«««»»»«««»»»«««
Please support this idea with a LIKE and COMMENT if you find it useful and Click "Follow" on our profile if you'd like these trade ideas delivered straight to your email in the future.
Thanks for your continued support.
Best Regards,❤️
Alikze.
»»»«««»»»«««»»»«««

Trading Signal For SOLUSDT Solana Trading Setup:
A Trading Signal is seen in the SOLUSDT
Traders can open their Sell Trades NOW
⬇️ Sell now or Sell on 151.25
⭕️SL @ 156.50
🔵TP1 @ 129.80
🔵TP2 @ 118.90
🔵TP3 @ 102.00
What are these signals based on?
Classical Technical Analysis
Price Action Candlesticks Fibonacci
RSI, Moving Average , Ichimoku , Bollinger Bands
Risk Warning
Trading Forex, CFDs, Crypto, Futures, and Stocks involve a risk of loss. Please consider carefully if such trading is appropriate for you. Past performance is not indicative of future results.
If you liked our ideas, please support us with your likes 👍 and comments .

SOLUSDT IDEASOL breaks its resistance of $160 and now going to test to act as support. Possible pull back is expected for the previous top of $210.

SOLANA Super Trend. SOL trend continues to look strong & one of the best charts out there. Possible deviation & liquidity grab lower to search some bid.

Solana, May Short on NY Session!? (Scenario 3)May we have this form.
If Price in 1H TF, Cross the High of Previous Candle.
We may have such position to short!
Wed 19 Jun - 9:38
