HA-RSI + Stochastic Ribbon: The Hidden Gem for Trend & MomentumNavigating volatile markets requires more than just raw price action. The Heikin Ashi RSI Oscillator blends the power of smoothed candlesticks with momentum insights to give traders a clearer picture of trend strength and reversals.
At Xuantify , we use the Heikin Ashi RSI Oscillator as a hybrid momentum and trend tool. While the indicator calculations are based on Heikin Ashi values to smooth out noise and better capture trend dynamics, the chart itself displays standard candlesticks (real price data) . This ensures that all signals are aligned with actual market structure, making it easier to execute trades with confidence and clarity.
This dual-layer approach gives us the best of both worlds: clarity from smoothing and precision from real price action. MEXC:SOLUSDT.P
🧠 How We Use It at Xuantify
At Xuantify , we integrate the Heikin Ashi RSI Oscillator into our multi-layered strategy framework. It acts as a trend confirmation filter and a momentum divergence detector , helping us avoid false breakouts and time entries with greater precision. We pair it with volume and volatility metrics to validate signals and reduce noise. Note the Stochastic Ribbon Overlay as shown in the chart, very accurate for momentum.
⭐ Key Features
Heikin Ashi Smoothing : Filters out market noise for clearer trend visualization.
RSI-Based Oscillation : Measures momentum shifts with precision.
Color-Coded Bars : Instantly identify bullish/bearish momentum.
Dynamic Signal Zones : Customizable overbought/oversold thresholds.
Stochastic Ribbon Overlay : A powerful multi-line stochastic system that enhances momentum analysis and trend continuation signals.
💡 Benefits Compared to Other Indicators
Less Whipsaw : Heikin Ashi smoothing reduces false signals common in traditional RSI.
Dual Insight : Combines trend and momentum in one visual.
Better Divergence Detection : Easier to spot hidden and regular divergences.
Visual Simplicity : Clean, intuitive design for faster decision-making.
⚙️ Settings That Matter
RSI Length : Default is 14, but we often test 10 or 21 for different timeframes.
Smoothing Type : EMA vs. SMA – EMA reacts faster, SMA is smoother.
Overbought/Oversold Levels : 70/30 is standard, but 80/20 can reduce noise in trending markets.
📊 Enhancing Signal Accuracy
Combine with Volume Oscillators to confirm momentum strength.
Use Price Action Zones to validate oscillator signals.
Look for Divergences between price and oscillator for early reversal clues.
🧩 Best Combinations with This Indicator
MACD : For cross-confirmation of momentum shifts.
Bollinger Bands : To identify volatility squeezes and breakouts.
Support/Resistance Levels : For contextual trade entries and exits.
⚠️ What to Watch Out For
Lag in Strong Trends : Like all smoothed indicators, it may react slightly late.
Over-Optimization : Avoid curve-fitting settings to past data.
Standalone Use : Best used in conjunction with other tools, not in isolation.
🚀 Final Thoughts
The Heikin Ashi RSI Oscillator is a powerful hybrid tool that simplifies complex market behavior into actionable insights. At Xuantify, it’s a core part of our strategy toolkit, helping us stay ahead of the curve with clarity and confidence.
🔔 Follow us for more educational insights and strategy breakdowns!
We regularly share deep dives into indicators, trading psychology, and backtested strategies. Stay tuned and level up your trading game with us!
SOLUST trade ideas


Sol{
"name": "SOLUSDT 1H Trade Watchlist",
"created_at": "2025-06-01T15:13:40.499874",
"symbol": "BINANCE:SOLUSDT",
"timeframe": "1H",
"strategies": [
{
"type": "long",
"title": "Breakout Buy Above Resistance",
"conditions": ,
"entry": "Above 154.50",
"take_profit": ,
"stop_loss": "151.90",
"notes": "Confirmation with bullish candle & RSI strength"
},
{
"type": "short",
"title": "Breakdown Sell Below Support",
"conditions": ,
"entry": "Below 152.00",
"take_profit": ,
"stop_loss": "154.30",
"notes": "Watch for momentum continuation and bearish confirmation"
}
]
}

SOL – High Confluence Bullish Zone ($149.7–$143)SOL is approaching a high-confluence bullish zone between $149.7 and $143, where multiple technical factors align. This area marks a key weekly order block, overlapping with bullish harmonic pattern completion levels, suggesting potential for a reversal or continuation of the broader uptrend. Additionally, the Fixed Range Volume Profile shows significant historical volume activity in this region, indicating strong interest from buyers. A daily trendline also converges at this level, adding further technical support. This stacked confluence makes the zone a high-probability area to watch for a bullish reaction or entry setup.


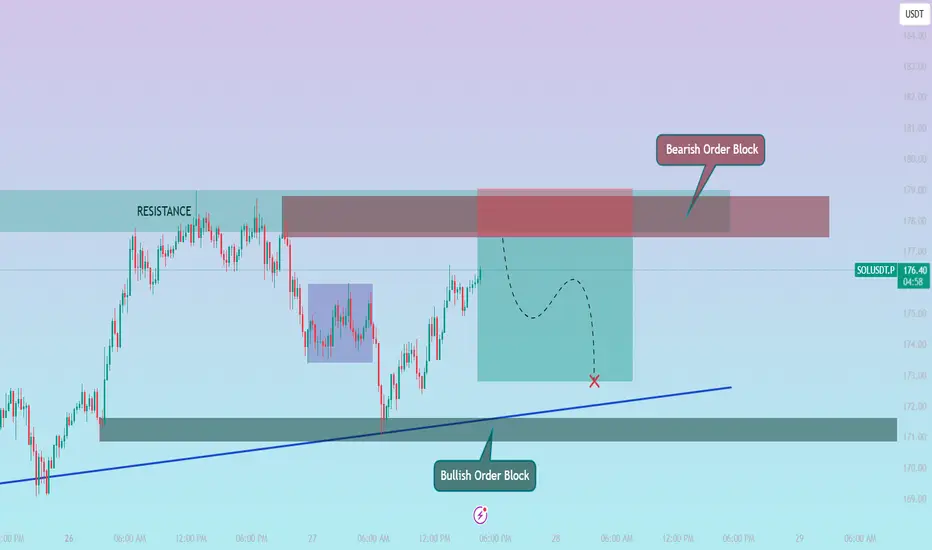
SOLUSDT – Short Setup Based on Price Action.Price recently tapped into a strong resistance zone between 177.61 – 179.00 after a solid bullish push. But instead of breaking out, we’re seeing rejection candles and slowing momentum — a sign that buyers might be losing control.
I’m expecting the market to form a lower high around this zone and start a downward correction. There’s also a rising trendline and a demand area below (near 171.63 – 170.82) where price could possibly bounce again.
🔽 Sell Entry: 177.47
🎯 Target: 172.81
⛔ Stop Loss: 179.03
Let’s see if the market respects this resistance and gives us a clean move down. Always manage risk wisely. 🔐
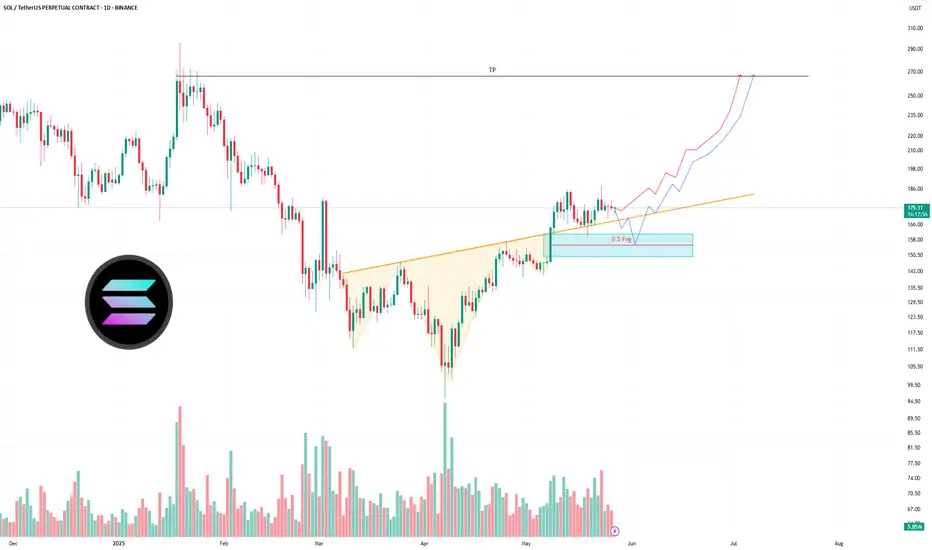
$145 Stop, $262 Target — SOL Bullish Breakout Looks UnstoppableThe chart presents a clean bullish reversal from the previous downtrend observed between February and early April. After breaking the long-term descending trendline, Solana (SOL) flipped structure and has been printing higher highs and higher lows, signaling a transition into an uptrend.
This is reinforced by the ascending blue trendline that currently acts as a dynamic support. Each price correction respects this trendline, showing that buyers are defending higher levels.
✅ Key Technical Justifications for Bullish Bias
1. Break of Downtrend
The long-term descending trendline from the February highs was broken decisively.
This signifies a trend reversal, which has since seen SOL push into a new bullish channel.
2. Strong Higher Lows
Price has been consistently making higher lows, respecting the blue uptrend line.
This price behavior confirms increasing bullish momentum.
3. Support Level Holding
The horizontal support around $96.59 was respected during the reversal.
This base forms the foundation of the bullish wave we’re seeing now.
4. Bullish Price Compression
After a strong impulsive rally, SOL has entered a consolidation just above the trendline.
This resembles a bullish flag or pennant, typically a continuation pattern.
5. No Major Resistance Until $260+
The nearest strong resistance sits around $262.56, which aligns with a previous breakdown zone and coincides with your take-profit (TP) zone.
With no serious resistance in the $200–$250 range, price can climb smoothly once bullish continuation triggers.
📊 Trade Setup (Long Position)
• Entry: Around $174.30 (current market zone as per chart)
• Stop Loss (SL): $145.00 (Below recent swing low and dynamic support — gives the trade breathing room)
• Take Profit (TP): $262.56 (Aligned with horizontal resistance and measured move target)
Risk-to-Reward Ratio: 2.91
Potential Reward: +50%
Potential Risk: -17%
This trade setup is not only favorable from a risk/reward standpoint but also follows price structure, trend, and technical confirmation.
🧠 Final Thoughts
Solana (SOL) on the daily chart has shifted into a clearly bullish phase after a textbook breakout from its multi-month downtrend. The current setup shows a healthy trend structure, room for price expansion, and favorable technicals across the board. The next key breakout will likely occur above $180, and that can send SOL quickly into the $240–$260 range. If you're looking to ride a swing position into Q2-Q3, this is one of the cleaner long setups currently on major altcoins.

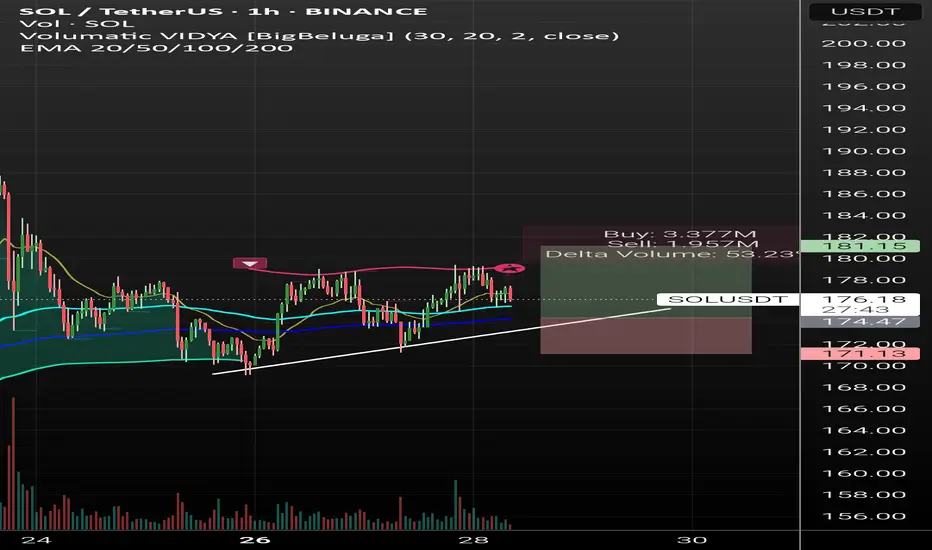
SOL/USDT Analysis – 1H Timeframe🟩 Entry: $174.00
🟥 Stop Loss: $171.13
🎯 Take Profit: $181.15
📈 R:R Ratio: ~2.4:1
Technical View:
Price respects ascending trendline support.
Entry near EMA100/200 confluence – strong technical demand zone.
Delta Volume +53.5% shows aggressive buyers.
EMA20/50/100/200 stacked upward → bullish structure.
Fundamental Bias:
$1B funding from SOL Strategies boosts institutional confidence.
Capital rotation signals long-term support for Solana ecosystem.
Market likely to price in bullish sentiment → supports long bias.
✅ Setup aligns technically and fundamentally. Justified long.
Solana Wave Analysis – 27 May 2025
- Solana rising inside daily up channel
- Likely to reach resistance level 186.10
Solana cryptocurrency recently reversed up from the support trendline of the daily up channel from the start of April (coinciding with the 20-day moving average).
The upward reversal from this support trendline continues the active impulse wave 3 of the intermediate impulse wave (3) from last month.
Solana cryptocurrency can be expected to rise to the next resistance level 186.10, which stopped the previous impulse wave 1 in the middle of May.


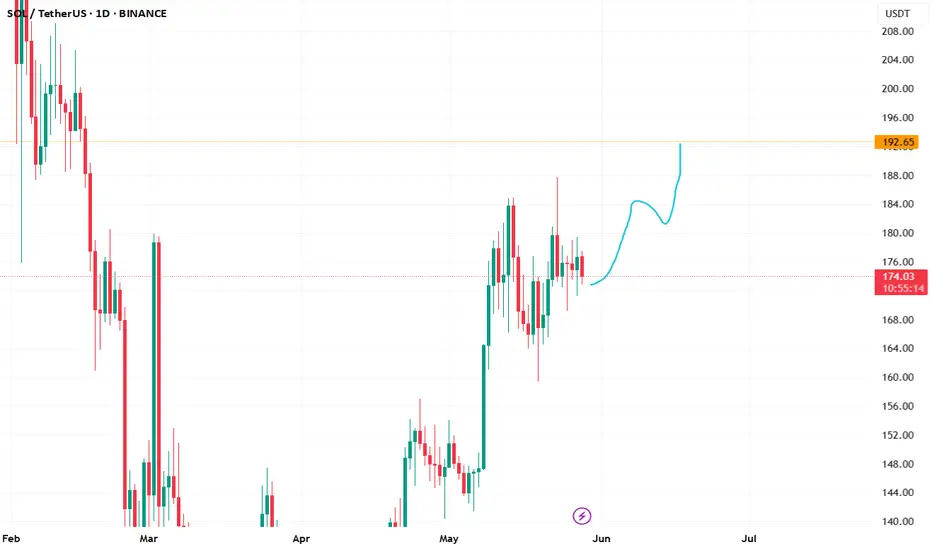
HolderStat┆SOLUSD channeling the sun toward $200CRYPTOCAP:SOL — After escaping a falling channel, price is tracking a neat growing channel between 170$ pivot and 200$ overhead resistance. Repeated consolidation diamonds reinforce upward trajectory and signal strength. Watch 160-165$ baseline—above it, 195-200$ target remains on radar.


Solana Short Term PossibilitiesBINANCE:SOLUSDT.P
I am sharing this analysis for myself, it is not investment advice.
Solana has a minor bullish trend and I think we are in a cricitical zone. İf solana go with the channel and pass its last peak we see 202.5 firstly. İf Solana break the channel there is a possibilty 160 support can hold us but if we break the 160, then the bearish move can go deeper.

Solana has broken out!The neckline was broken with a strong bullish candle.
After the breakout, price is currently retesting the neckline.
This area also aligns with previous structure and trendline breakout, strengthening the case for a bullish continuation.
Two possible bullish scenarios are outlined:
🔸 A direct continuation from current levels
🔹A deeper retest of the FVG zone before resuming the uptrend
📈 Target projection: Based on the height of the inverse H&S pattern, the potential upside targets the $260–$270 area.
📉 Invalidation: A clean break below the FVG zone (~$162) would invalidate the setup and suggest a deeper retracement.
Overall, the structure remains bullish until proven otherwise. Watching the next daily closes for confirmation.

SOL Crypto Futures Trade Plan 2025-05-26SOL Crypto Analysis Summary (2025-05-26)
Model Summaries
Grok/xAI Report
Technical: Price $176.77 above 20/50-day MAs but below 200-day SMA. RSI 60.6 (neutral-bullish). MACD shows slight bearish divergence. Bollinger bands suggest price near upper band. Sentiment: Limited positive news impact from luxury watch integration. Neutral funding rate. View: Moderately Bullish (75% confidence). Trade: Long at $177.50, SL $171.00, TP $183.00, 50× leverage, 1% equity position.
Claude/Anthropic Report
Technical: Similar MA and RSI readings; below 200-day SMA. Bollinger bands point to moderate volatility. Sentiment: Balanced funding rate; positive branding news but limited price impact. View: Moderately Bullish. Confidence 72%, below threshold—no trade recommended.
Llama/Meta Report
Technical & Sentiment: Aligns with Grok on MAs, RSI, Bollinger. Neutral overall market backdrop. View: Moderately Bullish (80% confidence). Trade: Long at $176.77, SL $171.74, TP $186.48, 75× leverage, 0.5% equity.
Gemini/Google Report
Technical: Bullish on short-term MAs and RSI but MACD bearish crossover and resistance at 200-day SMA. Sentiment: Neutral funding, niche positive news. View: Moderately Bearish short term (75% confidence). Trade: Short at $176.77, SL $179.50, TP $169.00, high leverage, size 1.
DeepSeek Report
Technical & Sentiment: Highlights 200-day SMA resistance and MACD divergence after 18.5% monthly rally. View: Bearish (75% confidence). Trade: Short at $176.77, SL $181.00, TP $171.74, size 1. Areas of Agreement and Disagreement
Agreement
Price is above the 20/50-day moving averages. RSI (~60) indicates healthy, not overbought conditions. Key resistance near the 200-day SMA (~$181) and upper Bollinger Band (~$186.5). Funding rates are neutral; no extreme positioning. Luxury watch news is a mild positive but not a strong market mover.
Disagreement
Directional bias: Three models lean moderately bullish (Grok, Claude, Llama), two bearish (Gemini, DeepSeek). Trade triggers: Bullish models target breakouts above current price; bearish models emphasize MACD crossover and 200-day SMA rejection. Position sizing and risk thresholds vary widely (1% equity vs. 0.5% vs. full contract). Conclusion
Overall Market Direction Consensus: Moderately Bullish Recommended Trade: Long SOL futures
Entry Range: 177.50 (to confirm continued upside momentum) Stop Loss: 171.00 (just below 20-day SMA) Take Profit: 183.00 (near upper Bollinger Band resistance) Position Size: 1 contract (≈1% of equity at 50× leverage) Confidence Level: 73% Key Risks and Considerations: MACD bearish divergence could trigger a short-term pullback. Strong resistance at the 200-day SMA (~$181) and upper Bollinger band. Correlation with BTC/ETH and broader crypto market swings. Volatility spikes can induce slippage—strict risk management required. TRADE_DETAILS (JSON Format)
{ "instrument": "SOL", "direction": "long", "entry_price": 177.50, "stop_loss": 171.00, "take_profit": 183.00, "size": 1, "confidence": 0.73, "entry_timing": "market_open" }
📊 TRADE DETAILS 📊 🎯 Instrument: SOL 📈 Direction: LONG 💰 Entry Price: 177.5 🛑 Stop Loss: 171.0 🎯 Take Profit: 183.0 📊 Size: 1 💪 Confidence: 73% ⏰ Entry Timing: market_open
Disclaimer: This newsletter is not trading or investment advice but for general informational purposes only. This newsletter represents my personal opinions based on proprietary research which I am sharing publicly as my personal blog. Futures, stocks, and options trading of any kind involves a lot of risk. No guarantee of any profit whatsoever is made. In fact, you may lose everything you have. So be very careful. I guarantee no profit whatsoever, You assume the entire cost and risk of any trading or investing activities you choose to undertake. You are solely responsible for making your own investment decisions. Owners/authors of this newsletter, its representatives, its principals, its moderators, and its members, are NOT registered as securities broker-dealers or investment advisors either with the U.S. Securities and Exchange Commission, CFTC, or with any other securities/regulatory authority. Consult with a registered investment advisor, broker-dealer, and/or financial advisor. By reading and using this newsletter or any of my publications, you are agreeing to these terms. Any screenshots used here are courtesy of TradingView. I am just an end user with no affiliations with them. Information and quotes shared in this blog can be 100% wrong. Markets are risky and can go to 0 at any time. Furthermore, you will not share or copy any content in this blog as it is the authors' IP. By reading this blog, you accept these terms of conditions and acknowledge I am sharing this blog as my personal trading journal, nothing more.


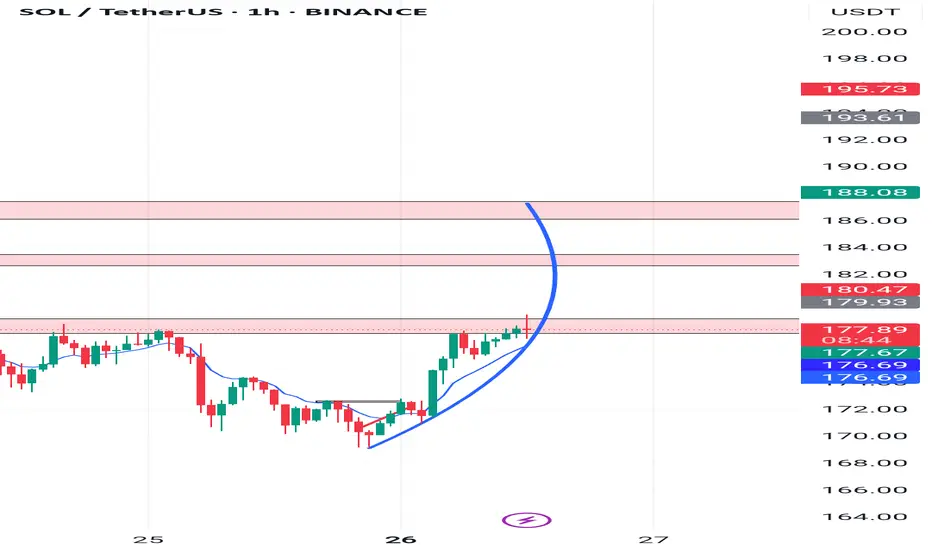
SOL/USDT Analysis (1H Timeframe)
Solana has shown a strong bullish reversal from the support zone around $170, forming a parabolic curve pattern, which often indicates strong bullish momentum.
Trend: Bullish, with steep upward movement and consistent higher highs and higher lows.
Support: The breakout level near $176.65 can act as a new support if price pulls back.
Immediate Resistance: Price is currently testing the $177.67 – $179.93 supply zone. A breakout above this could push SOL towards the next resistance at $180.47, and eventually towards the $186 – $188 zone.
Bias: Bullish continuation is likely if the current resistance is broken with volume. However, temporary rejection or consolidation is also possible here.

Solana's fate: pump or dump ?Hello friends
You see that Solana, after its good growth, got stuck in a range and is gathering strength. Now, considering the strong upward trend of this currency, it can be said that this force can push the price upwards, but everything is possible in the market, so observe capital management and trade with your will and wisdom.
*Trade safely with us*


