SOL/USDT 1H Chart Analysis – Bullish Reversal Targeting Resistan🚀 SOL/USDT 1H Chart Analysis – Bullish Reversal Targeting Resistance Zone 🎯
📊 Pair: SOL/USDT
🕐 Timeframe: 1H
📈 Platform: Binance
🔍 Technical Overview:
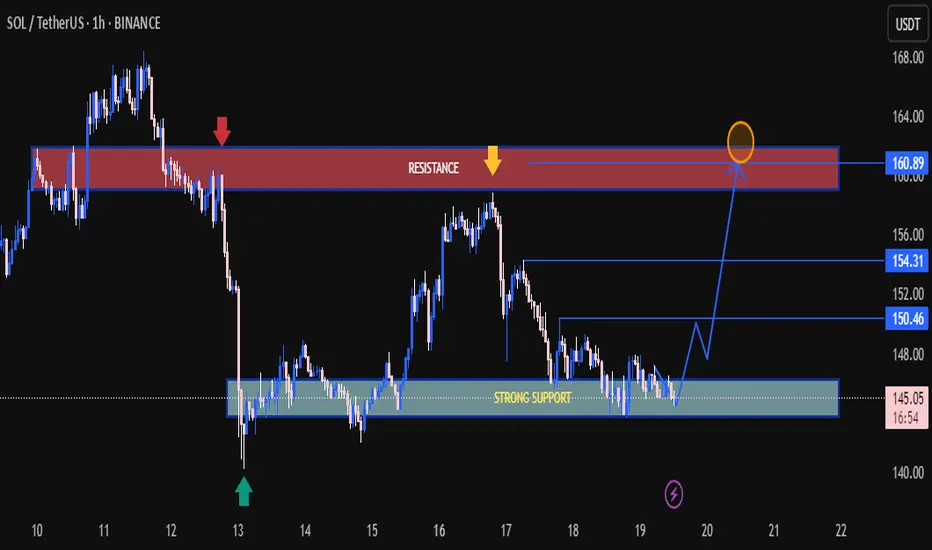
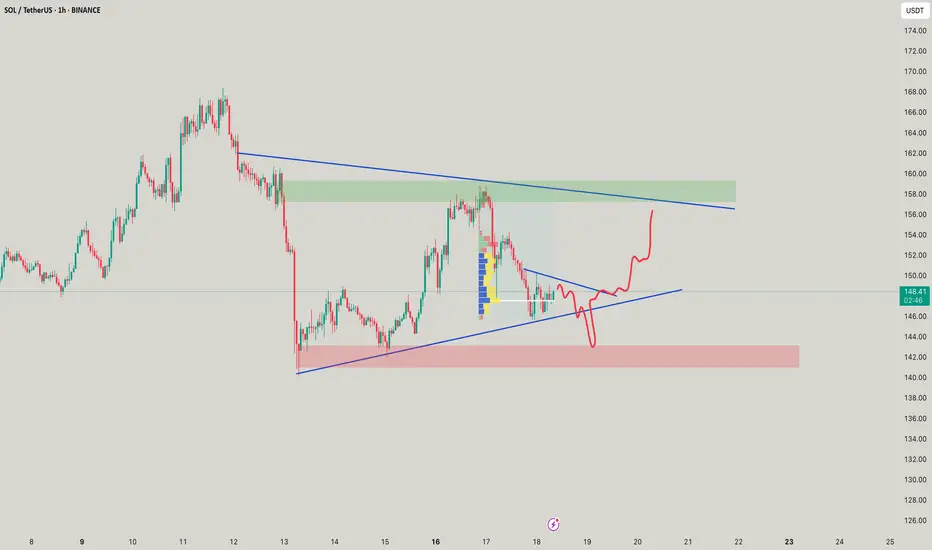
🔵 Support Zone (145.00 – 147.50 USDT)
Price has bounced multiple times from this strong demand zone marked in light blue.
Recent price action shows buyers defending this level aggressively — potential accumulation area. ✅
🔴 Resistance Zone (159.50 – 162.00 USDT)
Marked in red, this zone has historically rejected price twice (confirmed by red & yellow arrows).
Currently, the market is expected to retest this supply area once again. ⚠️
📈 Bullish Pathway:
Current structure suggests a reversal from support, aiming for:
TP1: $150.46
TP2: $154.31
TP3 / Final Target: $160.89 (within resistance)
🔄 Trend Structure:
Price is forming higher lows, hinting at early reversal stages.
Break above $150.46 would confirm bullish momentum. 🟢
🧠 Conclusion:
SOL/USDT is setting up for a bullish reversal from a strong support zone, with targets aligned toward previous resistance. Traders should monitor the reaction at $150.46 and $154.31 — a clean break may propel price to $160.89.
📌 Watch for:
Confirmation candle at support zone
Break and retest patterns on intraday resistance levels
📉 Support: 145.00 – 147.50
📈 Resistance: 159.50 – 162.00
🎯 Bullish Targets: 150.46 → 154.31 → 160.89
🔔 Stay updated, manage risk, and trade wisely! 💹📈
SOLUST trade ideas
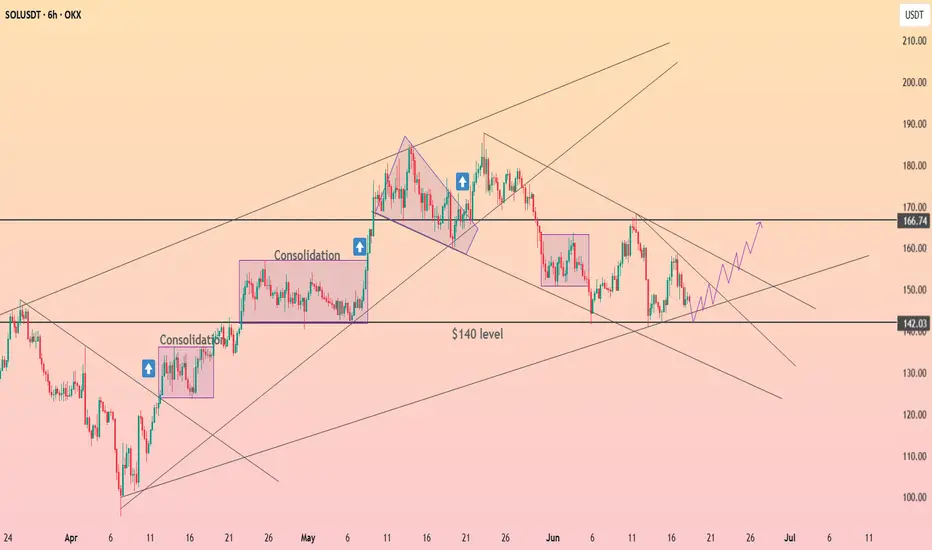
DeGRAM | SOLUSD channel floor launch toward 170+Solana continues to respect the broad rising channel that has guided price since early April. Recent corrective action tagged the channel median and then the intersecting 137-140 horizontal support, forming a classic confluence floor. The reaction: a sharp bullish rejection that restored price above the magenta internal trendline, indicating buyers remain in firm control. The corrective structure itself resembles a descending wedge losing bearish momentum, while RSI prints a positive reversal at 40 – conditions that often precede explosive upside resolution. A decisive close over 150 triggers an upside breakout aiming first at 160 (wedge objective) and subsequently at the 172-175 resistance block where prior distribution occurred. Should momentum spill over, the upper channel trajectory extrapolates 185-190 in coming weeks. Bullish bias is intact while candles close above 137; deeper dips into that zone likely represent opportunity rather than weakness.

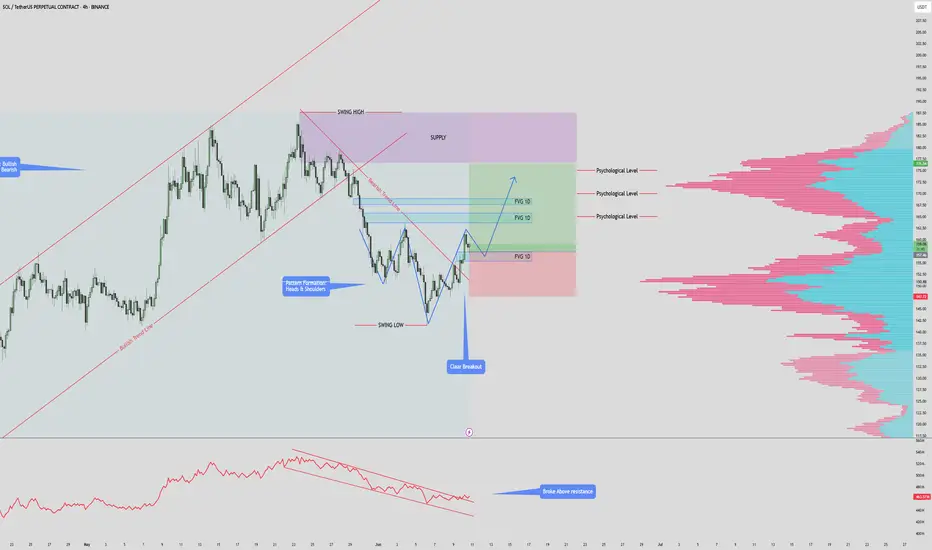
$SOLANA $180 PUMP INCOMINSOL/USDT – 4H Chart Summary
Market Structure:
HTF: Bullish trend remains intact.
LTF: Previously bearish, now showing early signs of a bullish reversal.
Pattern Formation:
Potential Inverse Head & Shoulders forming.
Neckline at $157 — must hold for pattern to complete.
Break above previous high will invalidate Inverse Head & Shoulders.
Trendline & Breakout:
Price has broken above the descending bearish trendline.
Indicates a momentum shift from bearish to bullish.
Fair Value Gaps (FVG):
1D FVG below current price – potential retest & long entry zone.
2x 1D FVG above price – act as targets or supply areas.
Psychological Levels & Volume:
Key levels at $165, $170, $175.
Volume profile shows high liquidity at each of these levels – strong TP zones.
OBV Indicator:
OBV has broken above resistance – supports bullish continuation.
Trade Scenarios:
Bullish Setup:
Long on retest of lower FVG zone ($142–$145).
Target TPs: $165 → $170 → $175 (align with psychological & high-volume areas).
Invalidation:
Break below FVG support or failure to hold above $142.

SOLUSDT Forming Bullish FlagSOLUSDT is currently forming a classic bullish flag pattern on the chart, which is often seen as a continuation pattern indicating the potential for a strong breakout to the upside. The price has consolidated within a tight range following a significant upward move, creating a flag-shaped formation that typically precedes the next wave higher. This structure is being supported by solid volume behavior, which is an essential confirmation for bullish breakouts. Based on historical performance and technical projections, a 50% to 60% gain could be on the horizon if this pattern resolves upward.
Solana (SOL) has remained one of the strongest-performing layer-1 blockchain projects in the market, and current investor sentiment is highly favorable. With recent developments in its ecosystem and increased institutional interest, SOL continues to attract substantial inflows. The bullish flag pattern aligns perfectly with the broader market optimism and technical indicators such as RSI and MACD that are showing early signs of renewed momentum.
Traders should watch closely for a breakout above the flag's resistance line, as this could trigger a new wave of buying pressure. Key levels to monitor include the breakout point and potential price targets around the previous highs and Fibonacci extensions. The market structure remains bullish, and if confirmed by volume and market momentum, SOLUSDT may offer one of the most attractive risk-reward setups in the current crypto landscape.
In summary, SOLUSDT is technically poised for another rally, supported by a bullish flag and growing interest from both retail and institutional investors. With a favorable risk profile and strong fundamentals, this is a setup that many traders will be watching in the coming days.
✅ Show your support by hitting the like button and
✅ Leaving a comment below! (What is You opinion about this Coin)
Your feedback and engagement keep me inspired to share more insightful market analysis with you!


SOL/USDT – The “Eye” of the Storm: Big Break Incoming?🧭 Summary:
Solana is coiling inside a symmetrical triangle after rejecting from its 2025 high. Price is trapped between $ 141–$ 167 with squeezing volatility, falling volume, and visible double top signs. The setup screams: “get ready for a breakout — or a breakdown.”
🔥 Key Confluences:
Eye-shaped compression pattern on 4H & daily
Support at $ 141 (trendline, demand zone)
Resistance at $1 55–162 (EMA cluster + structure)
Weekly chart still above key Fib (~$ 142), but weakening
📈 Trade Plan:
Bullish Scenario:
Break and close above $162–164 → target $171 then $187+.
Stop: below $ 149
Bearish Scenario:
Lose $141 support → target $120–100 zone.
Stop: above $155
🧠 Context:
Solana network is 🔥 — 1.2K TPS, 25M daily txns, $10B TVL.
Altcoin sentiment improving as BTC dominance dips.
But macro still cautious (Fed pause = volatility trap).
🎯 Final Word:
SOL is winding tighter than ever. A powerful move is coming.
📣 Breakout or breakdown — what’s your call? Drop your analysis below!

SOL: Short 19/06/25Trade Direction:
SOL Short - Hedge
Risk Management:
- Risk approx 0.5%
Reason for Entry:
- H1 supply zone at resistance
- H1 and M30 timeframes overbought
- M15 bearish divergence present
- Retracement into 0.718 Fibonacci level
- Weak lows beneath price drawing liquidity lower
- No breaker structure on higher timeframe; bearish grind continuing
- Trade set as a continuation with expectation of a lower high and further roll over
Additional Notes:
- Clear technical alignment for a short continuation trade
- Hedge against my FET Long

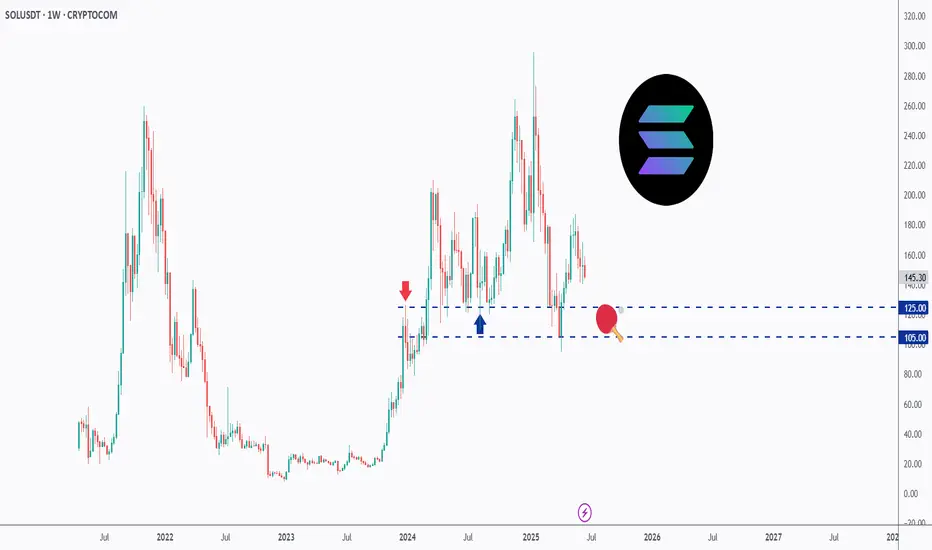
SOL - Playing Ping Pong!Hello TradingView Family / Fellow Traders. This is Richard, also known as theSignalyst.
📈SOL has been trading within a range between $100 and $200 round number.
And it is currently retesting the lower bound of the range which has been acting as a magnet lately.
As SOL approaches the $105 - $125 support zone, and as long as the $105 support holds, we will be looking for longs targeting the $200 round number.
📚 Always follow your trading plan regarding entry, risk management, and trade management.
Good luck!
All Strategies Are Good; If Managed Properly!
~Rich
Solana (SOL): Re-Testing Major Moving Average Line | 200 EMASolana has reached the 200EMA line on the daily timeframe, which has been broken recently after a long rally to upper zones. We caught 2 possible trades here, where one would be 1:5 RR and the second one would be 1:3 RR.
More in-depth info is in the video—enjoy!
Swallow Academy

Solana scalp shortRecently opened a scalp short position on solana. The market structurally is at LL point in usual market continuation but we having a big sell off it seems so could push lower down to $144.35 area before we get a bounce. In the event though I get stop I"ll look for a re-entry as $144.35 is like area to get tested before any major upside.


Weekly trading plan for SolanaBINANCE:SOLUSDT The price is already below the weekly pivot point. After updating the last bottom, the price may continue its downward movement. There are some level crossings so it is possible to reach them. More details in the video idea
Write a comment with your coins & hit the like button and I will make an analysis for you
The author's opinion may differ from yours,
Consider your risks.
Wish you successful trades ! mura

#SOL/USDT#SOL
The price is moving within a descending channel on the 1-hour frame, adhering well to it, and is heading for a strong breakout and retest.
We are experiencing a rebound from the lower boundary of the descending channel. This support is at 149.
We are experiencing a downtrend on the RSI indicator, which is about to break and retest, supporting the upward trend.
We are heading for stability above the 100 moving average.
Entry price: 153
First target: 155
Second target: 159
Third target: 162

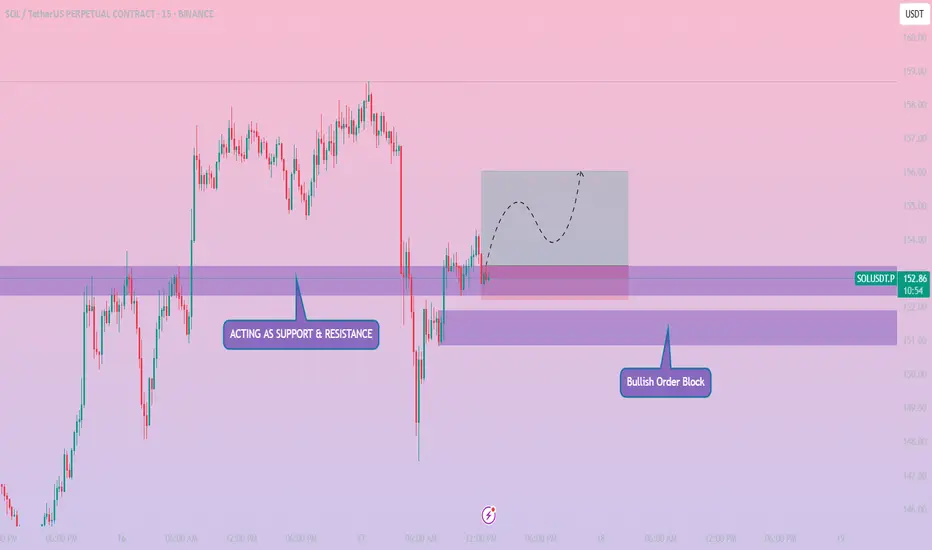
SOLUSDT // 15M // LONGPrice tapped into a previous support zone which is now acting as support & resistance flip, showing early signs of a bullish structure shift.
Just below, a clearly defined Bullish Order Block between ~151.00 and 152.20 is providing institutional demand, which strengthens this zone further.
The current entry sits slightly above this confluence, giving a high-probability long setup.
📈 Expected Price Path: Anticipating a possible liquidity grab, internal pullback inside the grey box, followed by continuation toward target liquidity around 156.00+.
🔹 Entry: 153.23 (Market Execution)
🎯 Take Profit (TP): 156.02
🛑 Stop Loss (SL): 152.22
📊 Risk-Reward Ratio (RRR): ~1:2.53

Impulse without purpose? Not in Smart Money termsSOL didn’t just break structure — it filled inefficiency and positioned above. Now price is sitting in the upper FVG, where decisions are made — not guesses.
What just happened:
Price rallied from the OB below and left an IFVG in its wake
Current price is hovering at the edge of a higher FVG, right where liquidity rests from trapped shorts
The move is complete — now it’s about what price does next in this zone of intent
From here, two paths:
Sweep into FVG, reject, and rotate back down toward the 154–147.4 range
React bullishly from mid-FVG, reclaim structure → break to new internal high and keep running
The OB down at 145 is still valid if price unwinds — that’s where Smart Money bids.
Execution view:
Rejection from 158–159 = short bias down to 147–145
Clean invalidation above FVG high
If price consolidates at 154 and reclaims → setup flips bullish
The setup isn’t about what price did — it’s about what it’s preparing for.
You want more trades like this — precision zones, mapped logic — check the profile description.

SOL | Key Demand Zone Retest in PlayBINANCE:SOLUSDT has pulled back into a major demand zone, following rejection from a local supply block. This zone previously acted as the base of the last impulsive move and now presents a critical level for a bullish reversal.
🟩 Key Demand Zone: $135–$125
• Valid demand cluster from April expansion
• Looking for bullish reversal signs or SFP before confirming entry
• Invalidates below $122.75
📌 Trade Setup (if confirmed):
• Entry near $125–130
• Target: $220 (79% upside)
• SL: Below $122.75
• R:R ≈ 4.88
🟥 Invalidation:
• Clean break below $122.75 = structure break
• Bearish continuation toward $102–105 zone
📌 This is the zone to look for strength — weak bounce = stand aside. Strong reaction = high R:R opportunity.

#SOL/USDT#SOL
The price is moving within a descending channel on the 1-hour frame, adhering well to it, and is heading for a strong breakout and retest.
We are experiencing a rebound from the lower boundary of the descending channel. This support is at 142.
We are experiencing a downtrend on the RSI indicator, which is about to break and retest, supporting the upward trend.
We are heading for stability above the 100 moving average.
Entry price: 144
First target: 149
Second target: 153
Third target: 157


SOLUSDT Perpetual–High R:R Short Setup from Key Resistance ZoneSOLUSDT printed a strong bullish impulse candle, reaching a key resistance zone around $151.76, where a short position has been opened, anticipating a potential reversal.
Trade Details:
Position: Short
Entry: $151.76
Stop Loss: $153.17 (0.88%)
Take Profit: $142.05 (6.44%)
Risk/Reward Ratio: 7.3, highly favorable for intraday or swing shorts
Setup Rationale:
Price tapped into a potential supply zone / previous resistance
Sharp move up without pullback may indicate overextension
Ideal for traders using a fade-the-pump or reversal-based strategy
This setup relies on a quick rejection from resistance, with tight risk control and a deep profit target — a clean and efficient play for high-risk:reward traders.
