Solana Breaks into an Ascending Triangle – Bullish Continuation Hello guys!
The chart shows Solana (SOL/USDT, 15m timeframe) forming a classic ascending triangle pattern during an ongoing uptrend. The upper resistance level around $206 has been tested multiple times, while the rising trendline from the bottom confirms consistent buying pressure and higher lows.
Trading activity
Transactions 59
BuysSells
2930
Volume 3.75 KUSD
Buys volumeSells volume
1.83 K1.92 K
Traders 41
BuyersSellers
2021
About SOLVVS_80FDCC.USD
Related DEX pairs
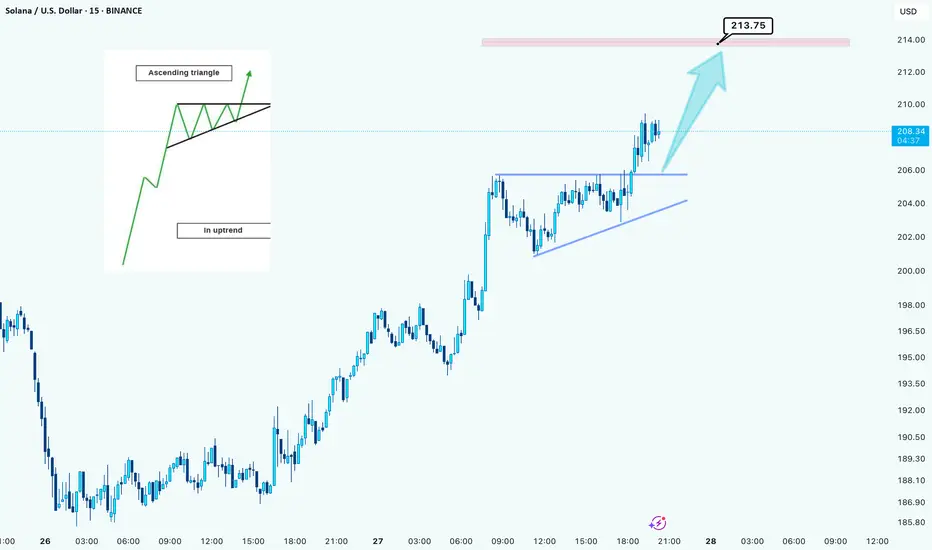
SOL - Time to buy again!The price has finally broken this bullish pattern and now is the time for the price to rise to $250.
PREVIOUS ANALYSIS

Solana -> a descending broadening wedgeHello guys!
A descending broadening wedge is forming, indicating a potential bullish reversal if price follows the typical pattern.
Pattern Analysis: Descending Broadening Wedge
The wedge is marked with two diverging trendlines, where the upper line is descending and the lower line slopes down

From Rocket to Rock: Solana’s Gravity CheckCRYPTOCAP:SOL may reach $262 as network adoption accelerates and throughput metrics hit new highs, but market dynamics are rarely linear. Cyclical retracements below $100 remain a distinct possibility, reflecting the interplay between speculative sentiment, ecosystem development, and the inherent v

Solana goes Bearish: Rising WedgeSolana is forming a rising wedge. Probably the price goes to $120 because there's a big resistance.

SOL's Situation, A Comprehensive Analysis !!!It appears that the price is forming a cup and handle pattern, and if this occurs, it could push the price above $215.
Best regards CobraVanguard.💚
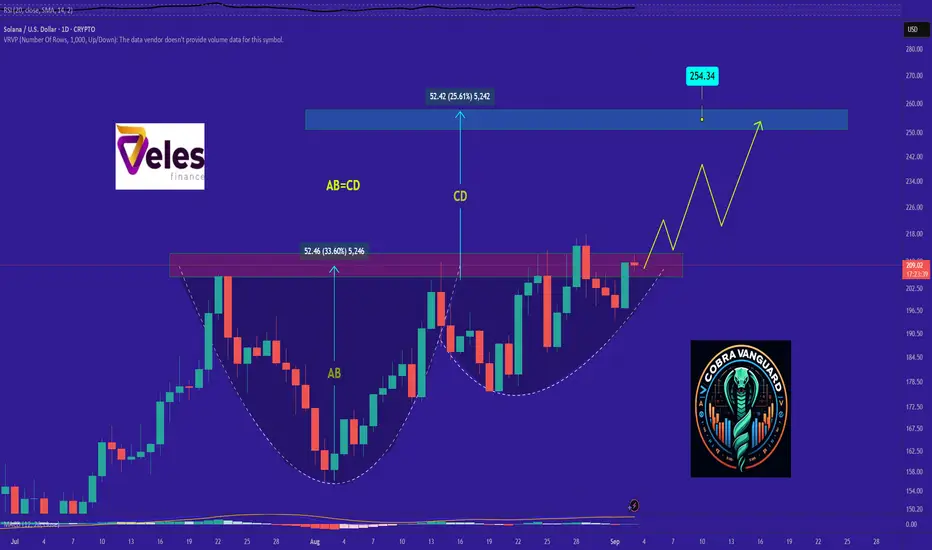
Solana (SOLUSD): Is a move to $252 coming?Solana is showing signs of a bullish reversal on the daily chart.
The price has retested and held a key support level at $196. This is a strong signal that buyers are defending this area.
Looking at the RSI, it has bounced from oversold territory, which supports the potential for a bullish reversal.

SOL/USD – Strong Push Above SMA200🟢 LONG above $205.67 – target $210.00+
Solana broke back above the 200 SMA ($194.11) and is pressing against resistance at $205.67. RSI at 62 shows solid bullish momentum. A breakout over $205.67 could fuel a move toward $210–$212.
📊 Keywords: #SOLUSD #BreakoutSetup #CryptoLong #AltcoinMomentum #S

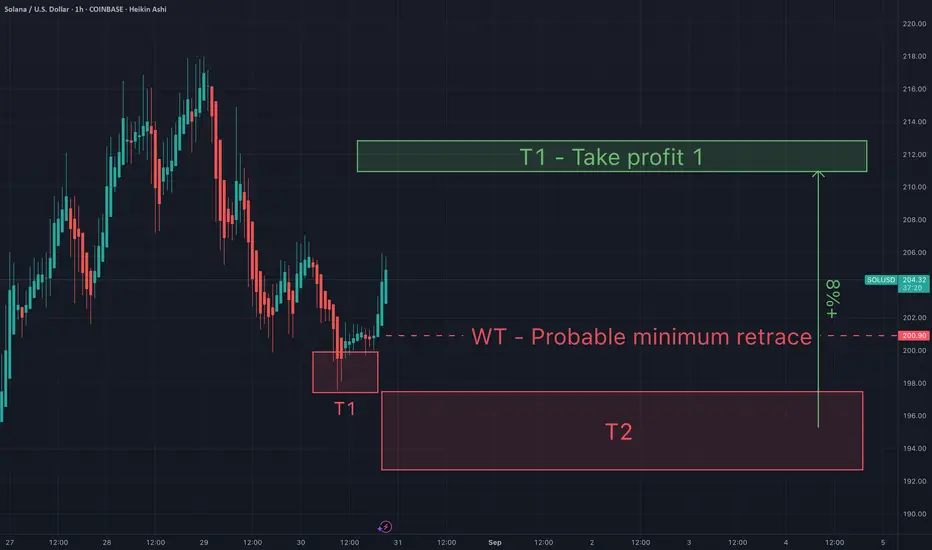
Sol - Support and resistance & take profit targetsSol - Support and resistance & take profit targets. Ideally Sol gets a retrace this weekend to my T2 so I can load up even more. Either way I'm taking profits at my green T1.
May the trends be with you.
01-09-2025 SOLUSDThe market is not always chaotic and disorderly, and there is a precise geometric beauty hidden in price fluctuations. The harmonic form long strategy is a powerful tool for accurately identifying potential market reversal points based on the Fibonacci ratio. When the form forms perfectly at the key

See all ideas
Summarizing what the indicators are suggesting.
Oscillators
Neutral
SellBuy
Strong sellStrong buy
Strong sellSellNeutralBuyStrong buy
Oscillators
Neutral
SellBuy
Strong sellStrong buy
Strong sellSellNeutralBuyStrong buy
Summary
Neutral
SellBuy
Strong sellStrong buy
Strong sellSellNeutralBuyStrong buy
Summary
Neutral
SellBuy
Strong sellStrong buy
Strong sellSellNeutralBuyStrong buy
Summary
Neutral
SellBuy
Strong sellStrong buy
Strong sellSellNeutralBuyStrong buy
Moving Averages
Neutral
SellBuy
Strong sellStrong buy
Strong sellSellNeutralBuyStrong buy
Moving Averages
Neutral
SellBuy
Strong sellStrong buy
Strong sellSellNeutralBuyStrong buy
Curated watchlists where SOLVVS_80FDCC.USD is featured.

Gen 3 crypto: A new day dawns…
25 No. of Symbols

Smart contracts: Make the smart decision
36 No. of Symbols

Staking Coins: Pick up a stake
18 No. of Symbols

Top altcoins: Choose your alternatives carefully
28 No. of Symbols

Up-and-coming crypto: New kids on the block
30 No. of Symbols
See all sparks