FTSE100 overbought pullback supported at 8880The FTSE remains in a bullish trend, with recent price action showing signs of a corrective pullback within the broader uptrend.
Support Zone: 8880 – a key level from previous consolidation. Price is currently testing or approaching this level.
A bullish rebound from 8880 would confirm ongoing ups
About UK 100, Daily
The FTSE UK Index Series is designed to represent the performance of UK companies, providing market participants with a comprehensive and complementary set of indices that measure the performance of all capital and industry segments of the UK equity market.
No news here
Looks like there's nothing to report right now

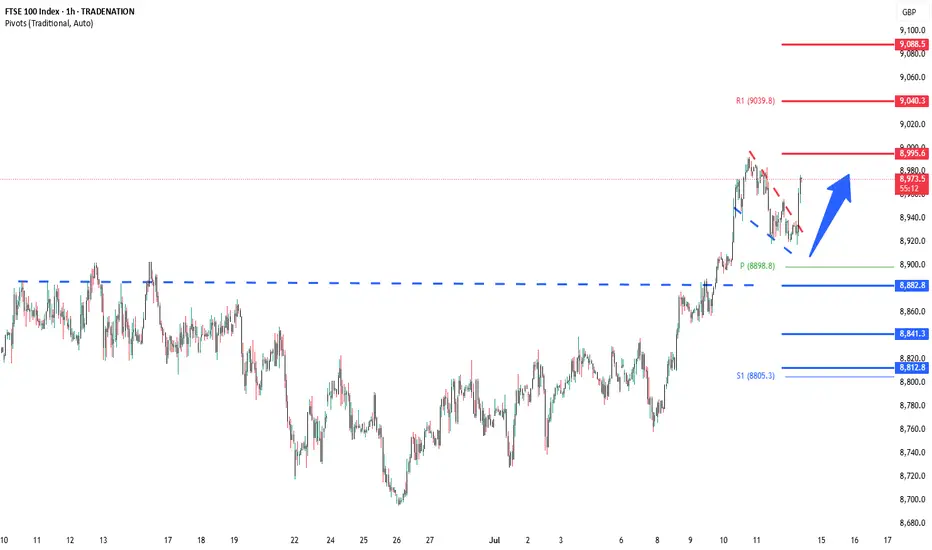
UK100 – Buy the Dip Near Support as Bottom FormsTrade Idea
Type: Buy Limit
Entry: 8,905
Target: 9,015
Stop Loss: 8,867
Duration: Intraday
Expires: 15/07/2025 06:00
Technical Overview
Price action is forming a potential bottom, suggesting that downside momentum is slowing.
The primary trend remains bullish, with no clear in

FTSE breaking out?Following a lengthy consolidation, the FTSE appears to be poking its head above the resistance trend of a triangle formation and resistance circa 8830-35 area today, potentially paving the way for a run to a new all-time high.
This comes as markets have taken the latest tariff threats from Trump in

5-Swing Elliott Wave Sequence in FTSE Supports Bullish BiasThe ongoing rally in the FTSE Index, originating from the April 7, 2025 low, continues to unfold as a five-wave impulse structure within the Elliott Wave framework. This signals sustained bullish momentum. From the April 7 low, wave 1 peaked at 7984.19. Wave 2 pullback followed which concluded at 75

FTSE oversold rally resistance at 8820The FTSE remains in a bullish trend, with recent price action showing signs of a corrective pullback within the broader uptrend.
Support Zone: 8740 – a key level from previous consolidation. Price is currently testing or approaching this level.
A bullish rebound from 8740 would confirm ongoing ups

UK100/FTSE100 - TIME TO SEND UK100 TO RECESSIONTeam, we are setting two strategies to the SHORT UK100/FTSE100
Ensure you understand your RISK - can always discuss with us in the room
Let's SHORT UK100/FTSE100, I still expect the market to be volatile even though the US expect a rate cut. on the 9th JULY, there will be a tariff announcement, and

FTSE INTRADAY continuation pattern breakout. The FTSE remains in a bullish trend, with recent price action showing signs of a corrective pullback within the broader uptrend.
Support Zone: 8880 – a key level from previous consolidation. Price is currently testing or approaching this level.
A bullish rebound from 8880 would confirm ongoing ups


FTSE 100 Wave Analysis – 10 July 2025
- FTSE 100 broke key resistance level 8900.00
- Likely to rise to resistance level 9100.00
FTSE 100 index recently broke above the key resistance level 8900.00 (which has been reversing the price from March, as can be seen below).
The breakout of the resistance level 8900.00 continues the active

See all ideas
Displays a symbol's price movements over previous years to identify recurring trends.
Frequently Asked Questions
UK 100, Daily reached its highest quote on Jul 10, 2025 — 8,993.1 GBP. See more data on the UK 100, Daily chart.
The lowest ever quote of UK 100, Daily is 4,780.8 GBP. It was reached on Mar 23, 2020. See more data on the UK 100, Daily chart.
UK 100, Daily is just a number that lets you track performance of the instruments comprising the index, so you can't invest in it directly. But you can buy UK 100, Daily futures or funds or invest in its components.