S&P 500 Breaks Out — Trump, Tariffs & Bullish Island PatternDonald Trump has mentioned the US stock market in every meeting he has held in the past few days, which has caused the US stock market indices , including the S&P500 Index ( SP:SPX ), to rise:
"Better go out and buy stocks now".
President Donald Trump told a crowd in Saudi Arabia on Tuesday that the markets are just getting started. “It’s going to get a lot higher,” he said, right as the S&P 500 posted its first gain since late February.
But one of the main reasons for the increase in the S&P 500 Index and US stocks is The United States has dropped its tariffs on Chinese goods to 30% , down from a brutal 145% , while China is slashing its own duties on US imports to just 10% , temporarily, for the next 90 days .
-------------------------------------------------
Now let's take a look at the S&P 500 Index chart on the daily time frame .
S&P500 Index managed to break the Resistance zone($5,737_$5,506) and 21_SMA(Weekly) by Breakaway Gap .
In terms of Classic Technical Analysis , the S&P500 Index has managed to form a Bullish Long Island Pattern , and this pattern is one of the continuing patterns and will be a sign of the continuation of the S&P500 Index's upward trend .
In terms of Elliott Wave theory , it seems that the S&P500 index has completed the corrective wave and is in new impulsive waves , which could cause a new All-Time High(ATH) to form.
I expect the S&P500 index to increase by at least +5% as it approaches the Uptrend line , and we will see the possibility of a new ATH .
Please respect each other's ideas and express them politely if you agree or disagree.
S&P 500 Index Analyze (SPX500USD), Daily time frame.
Be sure to follow the updated ideas.
Do not forget to put a Stop loss for your positions (For every position you want to open).
Please follow your strategy and updates; this is just my Idea, and I will gladly see your ideas in this post.
Please do not forget the ✅' like '✅ button 🙏😊 & Share it with your friends; thanks, and Trade safe.
S&P 500 Index - Standard & Poors 500 (SPX)
5,978.3USDR
−65.6−1.09%
At close at Jun 13, 20:59 GMT
USD
No trades
SPXM trade ideas

Down for SPX500USDHi traders,
SPX500USD went exactly to the target of my previous outlook.
After price came into the Daily FVG it rejected from there and started the correction down.
So next week we could see more downside for this pair to finish a bigger correction down.
Let's see what the market does and react.
Trade idea: Wait for a small correction up on a lower timeframe to trade short term shorts to the previous Weekly low.
If you want to learn more about trading FVG's & liquidity sweeps with Wave analysis, then please make sure to follow me.
This shared post is only my point of view on what could be the next move in this pair based on my technical analysis.
Don't be emotional, just trade your plan!
Eduwave

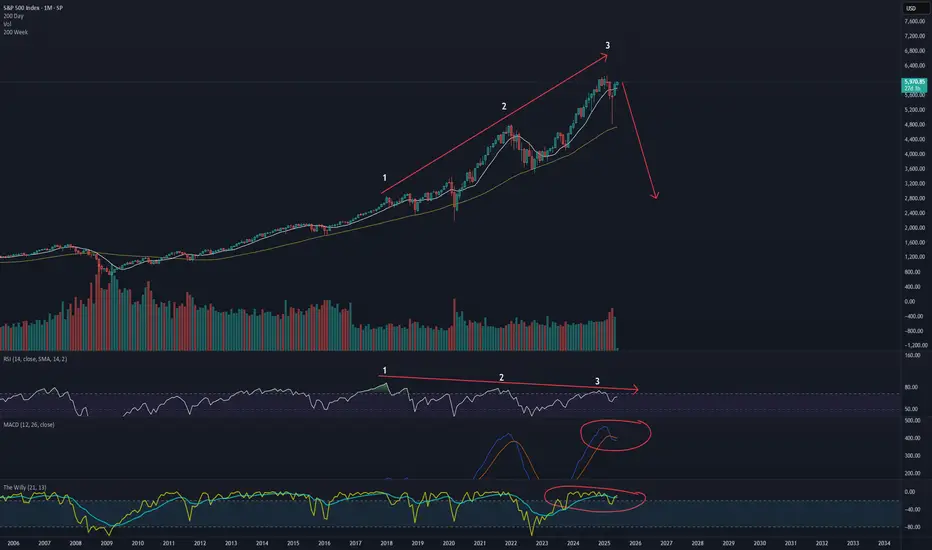
3 drives of bearish monthly divergence = bear market incoming"A bull market is like sex, it feels best just before it ends"
would like to draw attention to the bubble stocks and crypto right now, providing a definitive definition of mania.
The argument for a lost decade is in order.
The first decline in the spx will be aprox 55% to 2800, likely to recover its highs similar to how the market traded in the 1970's
SPX500 Macro + Technical + Probabilistic AnalysisPublished: June 3, 2025
🔍 Chart Breakdown (Daily | LuxAlgo + EW + SMC)
Structure Summary:
🔶 Wave Count: Completing Wave (5), with price nearing exhaustion
🔴 Weak High Zone: ~6,100–6,200 = liquidity magnet
🟥 Premium Zone: Between current price and 6,426
🟦 Equilibrium Zone: ~4,950–5,150
🟩 Discount Zone: ~4,150 = long re-entry or cycle bottom if correction occurs
📅 Key Timing Line: June 17, 2025 = potential reversal date (time-based confluence)
Volume Analysis:
🔊 Volume spikes at Wave 2 and Wave 4 suggest reactive participation
📉 Lower volume into recent highs suggests distribution, not accumulation
🔁 Multi-Timeframe Outlook
Timeframe Direction Probability Rationale
Intraday (15M) Bearish 60% Weak high rejection, premium zone swept, liquidity-based reversal
Swing (2–3 weeks) Bullish → Bearish 70% to 6,420 → then reversal Wave 5 completion into supply zone, followed by corrective ABC
Macro (Q3–Q4 2025) Bearish 80% Likely mean reversion toward equilibrium (5,000) or discount (4,200)
📊 Key Price Zones to Watch
Level Label Strategy
6,426 🎯 Wave 5 Target Look for exhaustion, divergence, or liquidity sweep
6,150–6,200 🟥 Weak High / Premium Possible fake-out zone or reversal trigger
5,900 🔵 Short-term support Likely retest zone on first rejection
5,150–4,950 ⚖️ Equilibrium Mid-cycle mean reversion target
4,150 🟩 Discount/Strong Low Long reload zone if correction deepens
⚠️ Risk Considerations
Macro Data Watchlist: June 12 CPI + June 17 FOMC = macro catalysts for Wave 5 peak
Invalidation: If price holds above 6,450 after June 17, EW count must be adjusted
Alternative Count: Parabolic Wave 5 extensions can overshoot — be cautious shorting early

SPX is overheated, a correction is necessary📉 Market Update: No, It Has Nothing to Do with Trump
This move has nothing to do with Trump’s dramatic announcements. The reality is simple: the MACD on the daily chart is overheated, and a healthy correction is needed — likely down to the 5,520 level — before resuming the uptrend.
Now, does it surprise anyone that Trump acts like a PR agent for his investors? He always seems to drop “bad news” at the exact moment the charts call for a pullback. My guess? They're shorting right now.
🪙 Bitcoin Stalling
CRYPTOCAP:BTC is also losing momentum, and looks like it’s in need of a short-term correction as well. This suggests a week of consolidation ahead for the whole crypto market.
But let’s be clear:
🚀 The Bull Market Is Not Over
The weekly charts remain very bullish, and this trend could last another 4–6 months. The macro bullish structure for crypto remains intact.
However, in TradFi, there are cracks:
🔻 20-year bonds sold at 5.1% — a major recession red flag
💸 Tariffs are putting pressure on global trade
📉 The entire traditional market is starting to de-risk
🔮 What to Expect
Short-term correction to ~5,518 (first bottom target)
A possible rebound after healthy consolidation
A continued uptrend in crypto unless key support breaks
I’ll publish a new update when conditions change.
📌 Follow me to stay ahead of the market. And as always: DYOR.
#CryptoMarket #Bitcoin #MACD #TechnicalAnalysis #CryptoCorrection #BullishTrend #RecessionWarning #TradFi #Altcoins #BTC #MarketUpdate #TrumpEffect #DYOR

The Second Blow-Offanyone casually looking at long-term charts can see in recent history on the monthly scale one of the most violent blow-off tops started In 1995-2000, running those 5 years up 240%. interestingly, my target and the number of years it takes to reach since the post-covid lows is almost the same

SPX500 Technical Outlook: Balancing Risk and RewardPost Content:
🔍 SPX500 Analysis - 4H Timeframe
Our latest technical analysis showcases a detailed approach to the S&P 500 Index using Smart Money Concepts, Fibonacci tools, and volume dynamics. Here's the breakdown:
1️⃣ Trend Structure
The price has formed a wedge within the premium zone, indicating potential exhaustion.
BOS and ChOCH markers highlight key pivots, emphasizing a weak high and strong low.
2️⃣ Fibonacci Insights
We're observing equilibrium near 5,668.57, a critical area where price may consolidate or pivot.
Higher Fibonacci extensions suggest an upside target near 6,580.38, should momentum hold.
3️⃣ Risk-Adjusted Strategy
Short Opportunity: Bearish retracement expected toward equilibrium; target around 5,668.57.
Long Opportunity: Look for confirmations to buy at the discount zone or post-retracement breakout above the weak high.
4️⃣ Volume Dynamics
Spikes at key pivot points signal institutional activity, strengthening the validity of liquidity zones.
📊 Trade Setup Overview
Entry: Short near premium zone OR Long near equilibrium/discount zone.
Stop-Loss: Place below the strong low for longs or above weak highs for shorts.
Target: Extensions at 6,580.38 align with the broader bullish sentiment.
🎯 Key Takeaway: This model emphasizes patience, precision, and risk management. Be sure to monitor upcoming macro events and confirm entry triggers before committing to any position.
🌟 Follow WaverVanir International LLC for more actionable insights, technical breakdowns, and AI-driven strategies!
📈 Trade Safe,
Team WaverVanir International LLC


usa 500 analyse*The content on this analysis is subject to change at any time without notice, and is provided for the sole purpose of assisting traders to make independent investment decisions.


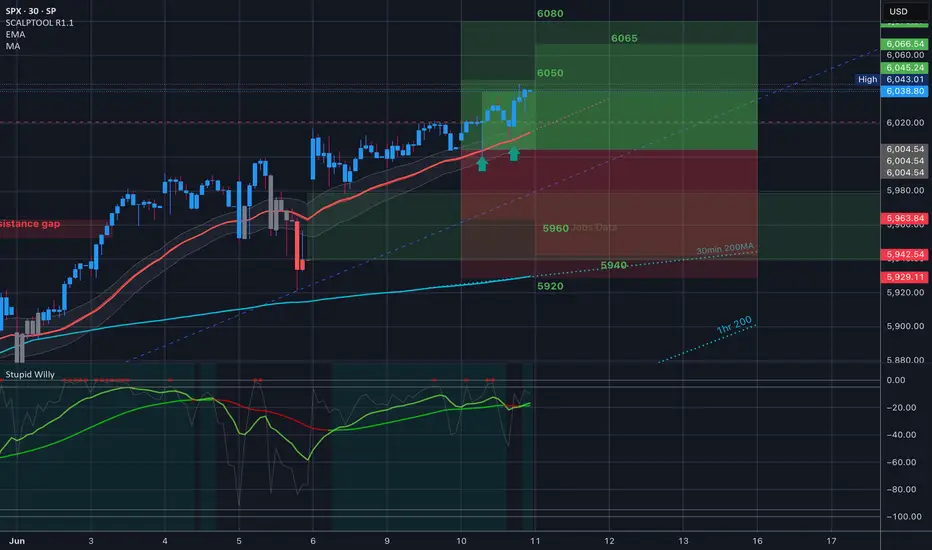
S&P500 INTRADAY consolidation range Boeing Crash: An Air India Boeing 787 crashed after takeoff from Ahmedabad to London, killing all 242 on board. It’s the worst accident involving this model. Boeing shares dropped on renewed safety concerns.
Trump Tariffs: Donald Trump plans to set new tariff rates within 1–2 weeks before a July 9 deadline. The EU may be last to get a trade deal. Japan is cautious about any agreement.
US-UK Trade Deal: The US and UK plan to move quickly on a trade deal. The EU is expected to face delays.
Tariff Pause: The US may extend a 90-day pause on tariffs for countries negotiating seriously.
Middle East Tensions: The US is pulling embassy staff as tensions rise. Iran warned of retaliation if nuclear talks fail. Reports say the US is preparing for a possible Israeli strike on Iran. Oil prices eased.
Key Support and Resistance Levels
Resistance Level 1: 6060
Resistance Level 2: 6120
Resistance Level 3: 6172
Support Level 1: 5960
Support Level 2: 5900
Support Level 3: 5800
This communication is for informational purposes only and should not be viewed as any form of recommendation as to a particular course of action or as investment advice. It is not intended as an offer or solicitation for the purchase or sale of any financial instrument or as an official confirmation of any transaction. Opinions, estimates and assumptions expressed herein are made as of the date of this communication and are subject to change without notice. This communication has been prepared based upon information, including market prices, data and other information, believed to be reliable; however, Trade Nation does not warrant its completeness or accuracy. All market prices and market data contained in or attached to this communication are indicative and subject to change without notice.

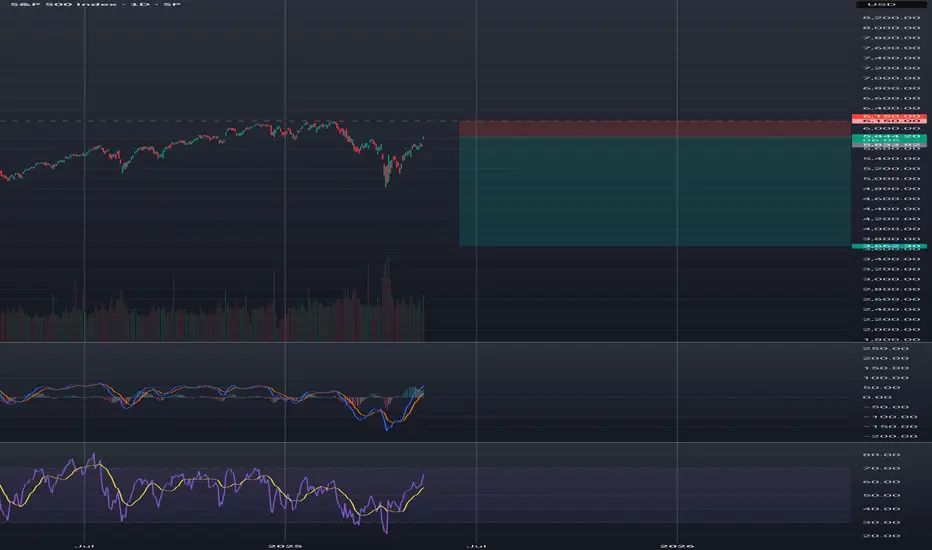
Recession? Weak. Let's Do a DepressionS&P pulled a fast one — but the real show might be just warming up.
Markets tease, bounce, tempt. And then — they punish.
After a sharp rebound, S&P500 is still below 6,150, with weak volumes. The recent rally looks more like a bear trap than a new impulse.
Trading note:
Possible short entries can be considered from current levels, with 50% now, 25% near 6,000, and 25% at 6,100. Stop-loss only after 4H close above 6,150. No clean levels below that — only noise and traps.
This market isn't about fundamentals. It's about desperation. Participants are chasing returns in a shrinking pie, taking on absurd risks.
And now, buckle up:
We are entering what might be the most dramatic market weeks in decades. This is setting up to be a mega-short, folks. Get ready for turbulence. Fasten your seatbelts.
---
Important:
This is NOT a recommendation to trade. This is an extremely high-risk scenario shared for discussion purposes only. If you've already made such a mistake and entered, respect your money and risk management. Losses are much harder to recover than gains.
SPX500 weekly overviewThis 6,136.54 calculated by 4821.59 and 3506.64 and worked really well as top of the SPX500!
Expect the zone around that line! All zones could be chosen to long the instrument.
4821.59 * 2 - 3506.64 = 6,136.54
The indicated levels are determined based on the most reaction points and the assumption of approximately equal distance between the zones.
Some of these points can also be confirmed by the mathematical intervals of Murray.
You can enter with/without confirmation. IF you want to take confirmation you can use LTF analysis, Spike move confirmation, Trend Strength confirmation and ETC.
SL could be placed below the zone or regarding the LTF swings.
TP is the next zone or the nearest moving S&R, which are median and borders of the drawn channels.
*******************************************************************
Role of different zones:
GREEN: Just long trades allowed on them.
RED: Just Short trades allowed on them.
BLUE: both long and short trades allowed on them.
WHITE: No trades allowed on them! just use them as TP points


**** Market Trading Strategy Idea SP500 ***Key Chart & Economic Insights:
- Current Market Position
- The S&P 500 is around $6000, showing positive momentum (+1.03%).
- Upward trend visible, indicating strong buying interest.
- Economic tailwinds support continued growth.
- Projected Price Movements
- 6800 USD: Key resistance level where selling pressure could emerge.
- Market pullback: A correction after 6800 may create a buyback opportunity.
- Recovery phase: Expected rebound toward 7000-7500 USD, another selling position.
- Economic Context: U.S. Manufacturing Boom & GDP Growth
- The United States is ramping up domestic production, boosting industrial output and reshoring manufacturing.
- This shift is fueling GDP growth, strengthening economic fundamentals and potentially sustaining bullish market momentum.
- Strong consumer spending & investment could drive stocks higher, aligning with the planned trade strategy.
Risk Management & Optimization:
- Entry & Exit Precision: Define stop-loss and take-profit levels.
- Momentum Confirmation: Ensure price action validates expected moves.
- Economic Indicators: Watch manufacturing & GDP data for trend validation.
If you want to refine this analysis or explore other scenarios, I'm here to dive deeper into key points! 🚀 Subscribe! TSXGanG
I hold a CCVM and MNC (Certificate of Competence to become a securities broker anywhere in Canada) and have been working as a trader for five years.
It’s a pleasure for me to help people optimize their trading strategies and make informed financial market decisions.

S&P 500 Index (SPX) Weekly TF – 2025
Chart Context:
Tools Used: 3 Fibonacci Tools:
1. One **Fibonacci retracement** (from ATH to bottom)
2. Two **Trend-Based Fibonacci Extensions**
* Key Levels and Zones:
* **Support Zone** (Fib Confluence): \~4,820–5,100
* **Support Area (shallow pullback)**: \~5,500–5,600
* **Resistance & TP Zones:**
* TP1: **6,450** (Fib confluence & -61.8%)
* TP2: **6,840** (-27%)
* TP3: **7,450–7,760** (Major Confluence)
Technical Observations:
* SPX is approaching a **critical resistance** near previous ATH (\~6,128) with projected upward trajectory.
* The **green dashed path** suggests a rally continuation from current \~6,000 levels to TP1 (\~6,450), TP2 (\~6,840), and eventually TP3 (\~7,450–7,760), IF no major macro shock hits.
* The **purple dotted path** suggests a potential retracement first to \~5,600 (shallow correction) or deeper into \~5,120 or even 4,820 zone before continuing the bullish rally.
* The major support zone around **4,820–5,120** includes key Fib retracement levels (38.2% and 61.8%) from both extensions and historical breakout levels.
Fundamental Context:
* US economy shows **resilience** amid soft-landing narrative, though inflation remains sticky.
* The **Federal Reserve** is expected to cut rates in **Q3–Q4 2025**, boosting equity valuations.
* Liquidity expansion and dovish outlook support risk assets, including **equities and crypto**.
* However, **AI-driven tech rally** may be overstretched; a correction could follow earnings disappointments or macro surprises (e.g., jobs or CPI shocks).
Narrative Bias & Scenarios:
**Scenario 1 – Correction Before Rally (Purple Path)**
* If SPX faces macro pushback (e.g., high CPI, hawkish Fed), expect retracement to:
* 5,600 = Fib -23.6% zone
* 5,120–4,820 = Major Fib Confluence Zone
* These would act as **accumulation zones**, setting up next leg up toward TP1 and beyond.
* **Effect on Gold**: May rise temporarily due to risk-off move.
* **Effect on Crypto**: Could stall or correct, especially altcoins.
**Scenario 2 – Straight Rally (Green Path)**
* If Fed confirms cuts and macro remains soft:
* SPX breaks ATH (\~6,128)
* Hits TP1 (\~6,450), TP2 (\~6,840)
* Eventually reaches confluence at **TP3 (7,450–7,760)**
* **Effect on Gold**: May struggle; investor preference for equities.
* **Effect on Crypto**: Strong risk-on appetite, altseason continuation.
Indicators Used:
* 3 Fibonacci levels (retracement + 2 extensions)
* Trendlines (macro and local)
* Confluence mapping
Philosophical/Narrative Layer:
This phase of the market resembles a test of collective confidence. Equity markets nearing ATHs while monetary easing begins reflect a fragile optimism. The Fibonacci levels act as narrative checkpoints — psychological as much as mathematical. Will we rally on faith or fall for rebalancing?
Bias & Strategy Implication:
Bias: Bullish with caution
* Strategy:
* Await **confirmation breakout >6,128** for fresh long entries
* Accumulate on dips in the **5,100–5,500** zone if correction unfolds
* Use **TP1, TP2, TP3** as staged exits
Related Reference Charts:
* BTC.D Analysis – Bearish Bias:
* TOTAL:Bullish Bias
*TOTAL3 – Bullish Bias:
* US10Y Yield – Falling Bias Impact:https://www.tradingview.com/chart/US10Y/45w6qkWl-US10Y-10-Year-Treasury-Yield-Weekly-TF-2025/


Remaining bullish on SPX and how I think through my chartsVideo Recap: The Zoomed Out View
Weekly moving averages are reordering and turning up
The weekly chart shows that the 10EMA and 20EMA have now crossed the 50SMA and are turning up. That reordering adds strength to the broader trend. This past week, the index reclaimed 6,000, which is a key psychological level. And we also saw price bounce off the uptrend line drawn from the April low, showing buyers are still defending key areas of support.
Daily pullback found support
The daily chart gave us a pullback the Friday before last, but it held right at a confluence of support (the 20EMA and 200SMA), along with a horizontal level drawn from the weekly timeframe.
Digestion periods can shake you out if you’re too zoomed in
The last few weeks have been a reminder that chop can test your patience and your plan. We didn’t break trend, we just pulled back to support. But if you’re too zoomed in, it can feel like everything is shifting. That’s when stops get hit early, trades get closed prematurely, and new positions get put on for the wrong reasons. In reality, this was just a normal digestion after a strong move. And when in doubt, zooming out brings the clarity back.
Trendlines and levels are guides, not absolutes
There were a few moments in my chart review this week where I caught myself trying to make lines matter more than they do. But these tools (trendlines, moving averages, support and resistance) only matter in the context of what price is doing around them. Structure tells the real story. One line getting hit or crossed doesn’t mean the whole thesis breaks down. What matters is whether buyers step in, whether trend resumes, and whether your trade idea still fits your system.
So what now? Here’s what I’ll be watching this week:
We’re holding above all major MAs.
If we push through the February all-time high, that can shift sentiment, especially for retail traders who may see that as a signal that “we’re in the clear.”
If we stall below the ATH, that wouldn’t be a problem by itself, but I’d watch how price behaves...ie are we pulling back constructively or losing key levels?
I’m not leaning bearish and won't be unless we start closing below 5,800 (200SMA) and definitely if we can't hold the rising 50SMA. (My second scenario after my bullish one is sideways, so bearish for me is out for now.)
When the market starts moving, the best thing you can do is trust your prep, lean into your plan, and zoom out when things get noisy. The bigger picture hasn’t changed.

SPX/USD Has A Double Top Pattern On The 1Hr Hey Traders and following gang!
Hope all are raking in profits on all your trades.
I spotted this double top setup on the 1hr SPX/USD.
A break below 5980.6 triggers a short down to target-1 5926.3
A break below 5943.8 triggers a short down to target-2 5842.1
A little scuffle in the Mid East helps this market fall so, short the ticker .
Best of luck in all your trades my friends and stay profitable $$$

S&P's 4Hr. Wave 5 North Likely in progress towards 61251). Price needs to complete 5-wave sequence @ the 1.728 Fib @ 6125). The Bonds are dropping, so there's likely not much steam left...3). BANKS ARE BUYING! 4). Volume is decreasing... 5). Trendline intersecting with target fib. level 72.8%. 6).US $ WEAKNESS AT THE MOMENT IS ALSO ADDING TO THE ANTICIPATED RISK ASSET UPWARD SCENARIO

S&P500 Giant Inverse Head and Shoulders waiting for its breakoutThe S&P500 index (SPX) appears to be forming the Right Shoulder of a long-term Inverse Head and Shoulders (IH&S), the pattern that made the April 07 bottom of the Tariff War correction.
Currently supported by both its 1D MA50 (blue trend-line) and 1D MA200 (orange trend-line), once the overhead Resistance/ neckline breaks, we expect a +24.55% rise to the 2.0 Fibonacci extension, the equivalent of the rise it made from the April bottom up until now.
The target given is 7400.
-------------------------------------------------------------------------------
** Please LIKE 👍, FOLLOW ✅, SHARE 🙌 and COMMENT ✍ if you enjoy this idea! Also share your ideas and charts in the comments section below! This is best way to keep it relevant, support us, keep the content here free and allow the idea to reach as many people as possible. **
-------------------------------------------------------------------------------
Disclosure: I am part of Trade Nation's Influencer program and receive a monthly fee for using their TradingView charts in my analysis.
💸💸💸💸💸💸
👇 👇 👇 👇 👇 👇

US500 Bullish Outlook US500 Bullish Outlook
US500 is well-positioned for another upward wave.
The price is forming a bullish triangle pattern, suggesting further gains if it breaks above the pattern or surpasses 5990.
Key upside targets are 6100 and 6240.
Investors are closely watching any new trade deal. If Trump rejects any deal or issues threats, the US500 could temporarily fall to 5930 before resuming its rise.
So far, the overall trend remains bullish, with no signs of reversal as long as key levels hold.
You may find more details in the chart!
Thank you and Good Luck!
❤️PS: Please support with a like or comment if you find this analysis useful for your trading day❤️
