S&P 500 Index - Standard & Poors 500 (SPX)
6,292.1USDR
+21.9+0.35%
As of today at 05:40 GMT
USD
No trades
SPXM trade ideas


V2. US S&P Zones - PMI Manuf, USINTR, Inflation, DXY & QEV2. US S&P Zones - PMI Manuf, USINTR, Inflation, DXY & QE
US S&P Zone Analysis -- Correlation with
1. Leading Economic Indicators (PMI Manufacturing Index, PMI Services Index, Building Permits)
2. US Interest Rates (MEAN 1.97 from Jan 2003)
3. US Inflation Rate YoY
4. Dollar Index (DXY)
5. Quantitative Easing Episodes
WHY CHANGE IN APPROACH?
As per Ammar Bhai, Red and other Zones for US and developed markets shall not follow only Interest Rates after 2000. Traditional single impact of Interest Rate is not Enough.
NOTE ABOUT INFLATION ABOVE 5%
It was also noticed that if inflation was about 5% that coincided with Red and Yellow zone and it must be avoided for stock trading.
NEW APPROACH
NEW GREEN ZONE
1. PMI Manuf Index is RISING or ABOVE 50
2. Interest Rates are FALLING or LEVELED or BELOW MEAN (Expansionary Policy in Effect)
3. Inflation is FALLING or AROUND TARGET
4. DXY is FALLING or SIDEWAYS
5. Stock Market RISING
NEW APPROACH for RED ZONE
1. PMI Manuf Index is FALLING or BELOW 50
2. Interest Rates are RISING or LEVELED or ABOVE MEAN (Contractionary Policy in Effect)
3. Inflation is RISING or SIDEWAYS. (Also Check if Inflation rate is above 5%)
4. DXY is RISING
5. Stock Market FALLING or SIDEWAYS
NEW YELLOW ZONE
1. PMI Manuf Index is RISING or ABOVE 50
2. Interest Rates are RISING or LEVELED
3. Inflation is RISING or SIDEWAYS (Also Check if Inflation rate is above 5%)
4. DXY is RISING or SIDEWAYS
5. Stock Market RISING or SIDEWAYS
NEW ORANGE ZONE
1. PMI Manuf Index is SIDEWAYS or BELOW 50
2. Interest Rates are FALLING or LEVELED or BELOW MEAN (Expansionary Policy in Effect)
3. Inflation is FALLING or SIDEWAYS (Also Check if Inflation rate is above 5%)
4. DXY is FALLING or SIDEWAYS
5. Stock Market RISING or SIDEWAYS
Historically whenever Interest Rates are dropping, US market goes down for some months:
US somehow try to control Inflation before bringing the interest rates down.
When Inflation is under control and Growth has not gone down much, then they decrease the interest rates
Because in past whenever Interest rates were decreased, growth also fell for some months and then improved.
Then FED does QE, which bring surplus cash in the market, Which drops Dollar rate, that helps the Stock Market grow.

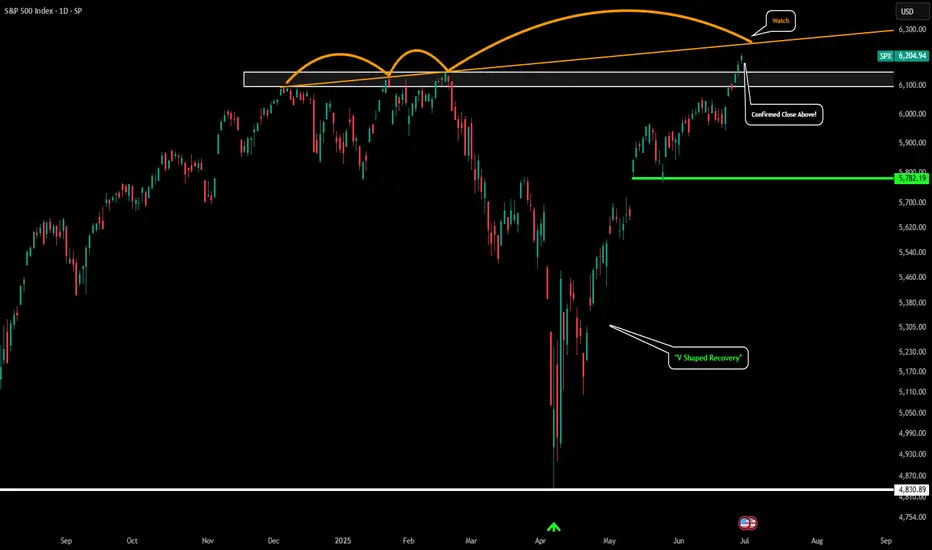
S&P 500 - Confirmed New All Time HighPlease refer to our last post:
The S&P could now be gearing up for the run towards our 1.618 extension around $7k.
We just had a confirmed daily candle breakout above our white box which we have been eyeing for so long. This is the first signal of a major ATH breakout rally for the S&P.
However there is only one thing that could potentially hinder this rally. That would be the orange trendline I have drawn. If price gets rejected somewhere along this orange trendline and price falls back below the white box that would signal a few warning signs. The first would be a failed breakout and the second would be a massive bearish divergence forming on the HTF. With higher highs in price but strength continuing to get weaker keep an eye out for that.
So far things just look great, but just wanted to point that out as a potential scenario.

SPX500 Detailed Trading Game Plan🎯 Current Market Context:
Current Price: 6,000 (Approx.)
Trend: Bullish; forming higher highs and higher lows.
Key Technical Observations:
Strong support and trendline respecting bullish structure.
Fibonacci confluence points towards potential upside momentum continuation.
Volume Profile indicating key levels at 5,950–6,000.
🚦 Trading Scenarios & Probabilistic Setups:
🟢 Scenario A (High Probability Long Trade ~65%):
Entry Zone: Current Levels (6,000–5,950) or retest to 5,863 support.
Stop Loss: Below 5,709 (critical structural support).
Targets:
Primary: 6,262 (100% Fibonacci Extension)
Secondary: 6,460 (Key Horizontal Resistance)
Risk-to-Reward: Favorable (~1:3)
🟡 Scenario B (Medium Probability Short Trade ~45%):
Entry Zone: 6,460–6,500 (strong resistance confluence)
Stop Loss: Above 6,600 (clear invalidation)
Targets:
Primary: 6,100 (structural retest)
Secondary: 5,950–5,863 (previous support zone)
Risk-to-Reward: Good (~1:2)
🔴 Scenario C (Low Probability but High Reward Long Trade ~35%):
Entry Zone: Deep retracement at ~5,408–5,106
(Invalidated if price breaks below 5,107.)
Stop Loss: Below 5,107 (firm invalidation)
Targets:
Primary: 5,950 (key resistance)
Extended: 6,460–7,176 (long-term bullish target)
Risk-to-Reward: Excellent (~1:5+), but lower likelihood of triggering.
📊 Probability & Risk Management Summary:
Scenario Probability Risk Reward Potential
A (Long) 65% ✅ Moderate High
B (Short) 45% ⚠️ Moderate Moderate
C (Long Deep) 35% ❗ Lower Very High
⚙️ Recommended Approach:
Primary Strategy: Bullish Continuation (Scenario A) due to current market structure and volume profile confirmation.
Secondary Consideration: Watch closely for Short Setup (Scenario B) only upon clear resistance signals.
Contingency Setup: Deep retracement (Scenario C) provides excellent value entry if fundamentals trigger a major correction.
🛠 Trade Management Tips:
Position Size according to scenario probabilities. Allocate larger sizing to Scenario A, cautious sizing for Scenario B, and small, speculative sizing for Scenario C.
Trailing Stops: As price approaches targets, adjust stops to lock profits progressively.
🗓 Timeline & Key Levels for Reference:
Immediate actionable trades: Scenario A (Long) setup at current levels.
Monitor closely by Mid-August 2025 for Scenario B potential short setup.
Watch closely for deep retracement scenario by November 2025 if substantial correction occurs.
🚨 Important Note: Always adjust your trades dynamically based on evolving macroeconomic and geopolitical news. These probabilities are guidelines—not certainties.
⚠️ Disclaimer:
Trading involves substantial risk and is not suitable for every investor. The information provided is purely for educational and informational purposes and does not constitute financial advice, a recommendation, or solicitation to buy or sell any financial instrument. Always perform your own analysis, consider your financial situation and risk tolerance, and consult with a qualified financial advisor before executing trades. Past performance does not guarantee future results. You alone bear the full responsibility for any investment decision you make.
Stay disciplined, trade wisely, and good luck! 🍀📊

Stocks Are Crushing It at Record Highs. What’s Behind the Rally?Happy record highs, everyone — confetti, champagne, and yet another all-time high. The Nasdaq NASDAQ:IXIC and the S&P 500 SP:SPX just did it again — notched fresh closing records that have traders flexing their P&Ls like it’s 1999.
If you’ve been on the sidelines, you’re probably staring at the chart asking: How did we add trillions to market cap while my grocery bill still looks like a high-yield bond payment?
Good question. Because these days, stocks are behaving like they live on a separate planet from the actual economy (looking at you, Nvidia NASDAQ:NVDA ).
Let’s pop the hood and see what’s revving this record-breaking machine — and what potholes might lurk ahead.
🤫 Nasdaq: The Comeback Kid of 2025
Take the Nasdaq Composite NASDAQ:IXIC — your favorite tech playground — up a mind-boggling 32% since the April lows . One-third of its total value was minted in three months — as much as $7 trillion added in.
What happened? Well, start with the obvious: the Magnificent Seven are doing the heavy lifting again. Nvidia NASDAQ:NVDA , Microsoft NASDAQ:MSFT , Apple NASDAQ:AAPL , Amazon NASDAQ:AMZN , Alphabet NASDAQ:GOOGL , Meta NASDAQ:META , Tesla NASDAQ:TSLA — they’re the gym rats of this rally.
But here’s the kicker: while the headlines are all “index record highs,” the Mag 7 as a whole are actually down slightly for the year. The hero’s cape belongs mostly to a few standouts: Meta, up 21% this year. Microsoft, up 17%. And Nvidia? Not bad: up a whopping 65% since the April swoon.
When the generals lead, the army follows — at least until they don’t?
🤖 S&P 500: Powered by 7, Dragged by 493
The broad-based S&P 500 also clocked a new record close at 6,173.07 . Everyone loves to toast a new all-time high, but here’s your buzzkill: the “500” in S&P 500 is a bit of a myth these days.
The Magnificent Seven alone account for more than 30% of the index’s total weight. Last year, this elite club rose 57% while the other 493 stocks crawled up just 13%. Strip out the hyper-scalers, and you’ll find most stocks are still limping along, wrestling with tepid growth and stubborn inflation.
So yes — the S&P 500 is soaring. But the S&P 493? Not partying at the same rooftop bar.
💼 Conflicting Data: This Economy Ain’t It (Yet)
Here’s where it gets spicy: GDP actually shrank last quarter — down 0.5% year over year. Inflation is still running hot with May’s PCE figure at 2.7% (the Fed’s target is 2%).
Fed boss Jay Powell and the central bank squad are trying to thread the world’s tiniest policy needle: cut rates enough to juice the economy, but not so much that they stoke a fresh inflation flare-up.
Meanwhile, job numbers are a mixed bag , and corporate revenue hasn’t been setting new records to match those ceiling-high stock valuations.
In short, the disconnect between equity prices and economic reality is growing wider than the spread on your favorite meme coin during an illiquid Sunday afternoon.
👨🏻💻 Tariffs, Tweets, and the Trump Factor
And who could forget the wildcard factor? Trump’s new tariffs. The “reciprocal tariffs,” as he likes to pitch them. One day he’s threatening to slap 50% duties on everything from French wine to German cars. The next, he’s cozying up for “productive” chats with Brussels.
This policy whiplash makes supply chains sweat, but so far, equity traders are shrugging it off — and even cheering. Why? Because in Trump’s world, chaos means central banks might cut rates to cushion the blow. And nothing says “rocket fuel” for risk assets like lower borrowing costs.
Add to that the weird paradox that tariffs — while inflationary in the short run — can also weaken the dollar if the Fed turns dovish. A weaker greenback means US tech giants look cheaper to global investors. So… up we go.
🏛️ The Great Fed Cut Watch
Speaking of cuts: the Fed’s next meeting is in late July, and Wall Street is holding its breath. Rate cuts mean cheaper money — which often means traders load up on risk.
The market is currently pricing in a 90% chance of a cut in September (and an 80% chance of a hold in July). Meanwhile, gold OANDA:XAUUSD — the non-yielding safe haven — is selling off while traders are flocking toward the risk-end of the boat, leaving the safe-haven corner gathering dust.
👀 What’s Next? The Inevitable Hand-Wringing
So — should you pop champagne? Depends.
If you’re a trend follower, record highs are record highs. Momentum is your friend. But if you’re a value purist, these multiples probably make your eye twitch.
Big question: when does this all get too frothy? Will the next earnings season justify these valuations? Markets are forward-looking anyway — even if big tech’s revenue flops, that doesn’t mean money will flow out of the market cap.
After all, we’re halfway through the year and that means it’s time to pop open the Earnings calendar for those spring reports.
Any dip right now may very well be seen as an opportunity to swoop in at a lower price, not as something that indicates there’s something fundamentally wrong with the business.
🫶🏻 The Takeaway: Celebrate, but Stay Focused
The rally is real. The headlines are dazzling. But the same lessons apply: trends don’t last forever, risk doesn’t disappear just because the chart is green, and the Magnificent Seven won’t carry the world on their backs indefinitely.
So have your stop losses placed right, your position sizes sensible , and your eyes on the macro backdrop. Because record highs are fun, but holding the bag isn’t.
Off to you : Are you riding this rocket or waiting for the next dip? Drop your take below — are we so back, or about to crack?

US 500 Index – Uptrend Channels, Support and Resistance CluesPositive price activity continues to materialise within equity indices, with several over recent sessions, successfully posting new all-time high trades.
The US 500 index is no exception, with at the time of writing (7.30am Monday 30th June) a new upside extreme just posted at 6208, see chart below.
However, such moves into new all-time high ground, which effectively is uncharted territory, can offer a challenge to traders. There is obviously difficulty in assessing where next resistance levels might stand. Just because an uptrend price pattern is evident and new all-time highs are being posted, doesn’t guarantee further price strength.
There will be levels where sellers, or resistance, are found again that might create at least a short term sell-off in price, even a more extended phase of price weakness.
However, how perhaps might we be able to judge where these levels may stand, when an asset is trading at price levels previously not seen?
Within technical analysis there is a tool that can potentially help traders gauge where next resistance might be encountered – The Uptrend Channel.
Let’s take look at uptrend channels and the US 500 index, and where possible clues might be offered to where both support and resistance levels may currently stand.
The Uptrend Channel:
We have previously discussed uptrends (and downtrends) in previous reports, so please look at our timeline for further details.
However, the basic definition of an uptrend line, is a straight line connecting previous price lows. In the chart below, we look at the US 500 index and have drawn a straight line connecting the 5095 low, posted on April 21st, with 5913, the June 23rd low.
This uptrend line today (June 30th 2025) stands at 6000, and traders may now be viewing this as a potential support to price weakness, if seen. It’s held on 2 previous occasions, April 21st and June 23rd, and may do so again, if price weakness approaches this line in the future. Please note, this is a rising trendline, so the support level will move higher each day.
Now look at the chart above again, you’ll notice we have also now drawn a trendline parallel to the lower uptrend line, which connects with the 5958 May 16th price high. This line also moves higher each day, as it too represents an uptrend and today stands at 6527.
While much will continue to depend on future market sentiment and price trends, if (and as we know within trading, it is a big if!) prices continue to move higher and post new all-time price highs, traders may be watching this uptrend channel pattern to suggest both potential support and resistance price levels.
They may argue that while support, which today stands at 6000, marked by the level of the lower limits of the uptrend channel, remains intact, potential might be for a more extended phase of price strength. Possible resistance could then be 6527, the current level of the upper limits of the uptrend channel.
Please remember, these levels will change daily, and you will need to refer to your own Pepperstone charts to update these levels on a daily basis, as they will change for each sessions.
Looking Ahead:
Today marks the end of a volatile but impressive second quarter for the US 500 index. It saw a low of 4799 on Monday April 7th in the thick of the trading carnage caused by President Trump’s trade tariffs, but since the 90 day tariff pause was announced on April 9th the index has rallied steadily to register a new all time high at 6208 in Asia this morning. That’s a bounce of 29% in Q2!
The start of Q3 isn’t likely to be without its challenges, however. There are concerns that President Trump’s $4.5 trillion tax bill, that is moving through the Senate currently, could increase the US debt burden to unsustainable levels.
Also, the July 9th tariff deadline is getting closer by the day and only 1 trade deal has been announced during the 90 day pause, despite lots of talk that 10 more deals, including India, Japan and potentially the EU are in the pipeline.
Updates on the health of the US economy this week in the form of Non-farm Payrolls on Thursday (1330 BST) and ISM Services PMI (1500 BST) could be critical if markets expectations for Fed rate cuts later in the year are to materialise, and the next earnings season for US companies begins in the middle of next week as well.
How this all unfolds could help to determine whether the US 500 keeps recording new all time highs or begins to unwind the recent upside moves as risk sentiment sours again.
The material provided here has not been prepared accordance with legal requirements designed to promote the independence of investment research and as such is considered to be a marketing communication. Whilst it is not subject to any prohibition on dealing ahead of the dissemination of investment research, we will not seek to take any advantage before providing it to our clients.
Pepperstone doesn’t represent that the material provided here is accurate, current or complete, and therefore shouldn’t be relied upon as such. The information, whether from a third party or not, isn’t to be considered as a recommendation; or an offer to buy or sell; or the solicitation of an offer to buy or sell any security, financial product or instrument; or to participate in any particular trading strategy. It does not take into account readers’ financial situation or investment objectives. We advise any readers of this content to seek their own advice. Without the approval of Pepperstone, reproduction or redistribution of this information isn’t permitted.


S&P 500 Sets New All-Time High, Surges Above 6200S&P 500 Sets New All-Time High, Surges Above 6200
The S&P 500 index (US SPX 500 mini on FXOpen) started the week by reaching a fresh all-time high. As shown on the chart, the index hit 6,210 points earlier this morning.
In addition to a reduced risk of US involvement in a large-scale war in the Middle East, market optimism has been fuelled by:
→ Tariff-related news. Last week, the US President announced the signing of a trade deal with China, while Treasury Secretary Scott Bessent expressed hope that the US would conclude trade negotiations with over a dozen countries by early September.
→ Strong corporate performance. On Friday, Nike (NKE) shares led the stock market, rising by more than 15% following an earnings report that exceeded analysts’ expectations. This could be boosting investor sentiment ahead of the upcoming earnings season.
Technical Analysis of the S&P 500 Chart
Evaluating the 4-hour chart of the S&P 500 index (US SPX 500 mini on FXOpen) in the context of June’s price movements reveals key reference points (marked on the chart) that outline an ascending channel. A consolidation zone, marked with an arrow, highlights a temporary equilibrium between supply and demand—after which buyers gained the upper hand, pushing the price upward.
It is possible that the ongoing bullish momentum could carry the price toward the upper boundary of the channel. However, attention should be paid to the RSI indicator, which suggests the market is heavily overbought; in fact, Friday’s reading marked the highest level of the year. In such conditions, a price correction cannot be ruled out—potentially back toward the local ascending trendline (shown in orange).
This article represents the opinion of the Companies operating under the FXOpen brand only. It is not to be construed as an offer, solicitation, or recommendation with respect to products and services provided by the Companies operating under the FXOpen brand, nor is it to be considered financial advice.

SPX500 Extends Rally on Fed Hopes and China Trade DealS&P 500 Set to Extend Record Highs
U.S. stock futures climbed on Friday, continuing this week’s strong momentum on hopes of eased trade tensions and growing confidence in multiple Fed rate cuts later this year.
Futures tied to the S&P 500 and Nasdaq 100 pointed to fresh record-high openings, while the Dow Jones was set to rise by 150 points.
Adding to the bullish tone, Commerce Secretary Lutnick announced a trade agreement with China, reducing tariff risks and easing concerns over rare earth shortages.
TECHNICAL OUTLOOK – SPX500
The index has broken into new all-time highs (ATH) and stabilized above the 6,143 resistance level, confirming bullish strength.
As long as the price trades above 6,143, the uptrend is likely to continue toward 6,225, with potential short-term pullbacks to 6,143.
A 1H candle close below 6,143 could trigger a deeper correction toward the pivot zone at 6,098.
Key Levels
Resistance: 6,175 → 6,225
Support: 6,098 → 6,041
previous idea:

SPX: new ATH, despite allEconomy, geopolitics, trade tariffs, inflation, Fed moves. It seems that the market got tired of all news during the previous period, and decided to take the optimistic side, despite all. The S&P 500 reached a fresh, new all-time highest level on Friday's trading session, at 6.185. With the latest move, the S&P 500 managed to erase all losses from April this year, when the index tumbled around 20% after the implementation of trade tariffs.
The weekly trade tariffs news brought a termination of talks between the U.S. and Canada. However, what moved the market the most was the news that the US Administration settled a deal on trade tariffs with China. Although details of the deal were not publicly disclosed, still the market reacted very optimistic about it.
At the same time, the latest macro figures for the US are showing that the tariffs are slowly starting to reflect in the U.S. economy. The Fed's favorite inflation gauge, the PCE index increased by 0,1% in May, which was expected. However, the Personal Income and Personal Spending in May missed heavily market estimates. The Personal Income dropped by -0,4% for the month, while Personal Spending dropped by -0,1%. Analysts are pointing that these figures are showing that the US consumers are spending less due to increased prices of goods, after implementation of tariffs. At the same time, there was a slowdown in the U.S. GDP growth rate, final for Q1 was negative for the quarter, at the level of -0,5%.
Tech companies continued to be in the focus of investors' interest. APPL closed the week at $210,08, with a modest weekly gain of 0,24%. MSFT gained 3,87% for the week, closing it at $495,94. Market favourite NVDA surged by 9,74% within a week, closing at $157,75. AMZN also had a good week with a surge of 6,33%. Despite higher volatility, TSLA ended the week at 0,33% higher, underperforming other tech companies included in the index.


SPXI've been waiting patiently for a real correction in everything, but my timing was drastically off. Looks like FOMO is still in charge. My guess, stock market to ATH after ATH for a while and a final wave of FOMO for crypto will enter the air.
I believe the majority are expecting a COVID-like rebound, followed by rally continuation, but the majority tends to be wrong.
What I can tell you is the true crypto bull run will not begin on optimism, as it has been...
It will begin on pessimism.

US500/SPX500 Heist Plan: Grab the Index CFD Loot!Greetings, Profit Pirates! 🌟
Money chasers and market rogues, 🤑💸 let’s execute a daring heist on the US500/SPX500 Index CFD market using our 🔥Thief Trading Style🔥, powered by sharp technicals and deep fundamentals. Stick to the charted long-entry strategy, aiming to cash out near the high-risk Pink zone. Stay alert for overbought conditions, consolidation, or a trend reversal trap where bearish bandits dominate. 🏴☠️💪 Lock in your profits and treat yourself—you’ve earned it! 🎉
Entry 📈
The vault’s cracked open! 🏦 Snatch the bullish loot at the current price—the heist is on! For precision, place Buy Limit orders on a 15 or 30-minute timeframe for pullback entries, targeting a retest of the nearest high or low.
Stop Loss 🛑
📍 Set your Thief SL at the recent swing low (5640) on a 4H timeframe for day trades.📍 Adjust SL based on your risk appetite, lot size, and number of orders.
Target 🎯
Aim for 6160 or slip out early to secure your gains! 💰
Scalpers, Eyes Sharp! 👀
Focus on long-side scalps. Big capital? Dive in now! Smaller funds? Team up with swing traders for the robbery. Use a trailing SL to protect your loot. 🧲💵
US500/SPX500 Market Intel 📊
The Index CFD is riding a bullish surge, 🐂 fueled by key drivers. Dive into fundamentals, macroeconomics, COT reports, geopolitical news, sentiment, intermarket analysis, index-specific insights, positioning, and future trend targets for the full picture. 🔗check
⚠️ Trading Alert: News & Position Safety 📰
News can jolt the market! To safeguard your haul:
Avoid new trades during news releases.
Use trailing stops to lock in profits and limit losses. 🚫
Join the Heist! 💥
Back our robbery plan—hit the Boost Button! 🚀 Let’s stack cash effortlessly with the Thief Trading Style. 💪🤝 Stay ready for the next heist, bandits! 🤑🐱👤🎉

US500 Will Go Up! Long!
Take a look at our analysis for US500.
Time Frame: 1D
Current Trend: Bullish
Sentiment: Oversold (based on 7-period RSI)
Forecast: Bullish
The market is testing a major horizontal structure 6,165.52.
Taking into consideration the structure & trend analysis, I believe that the market will reach 6,451.04 level soon.
P.S
The term oversold refers to a condition where an asset has traded lower in price and has the potential for a price bounce.
Overbought refers to market scenarios where the instrument is traded considerably higher than its fair value. Overvaluation is caused by market sentiments when there is positive news.
Disclosure: I am part of Trade Nation's Influencer program and receive a monthly fee for using their TradingView charts in my analysis.
Like and subscribe and comment my ideas if you enjoy them!


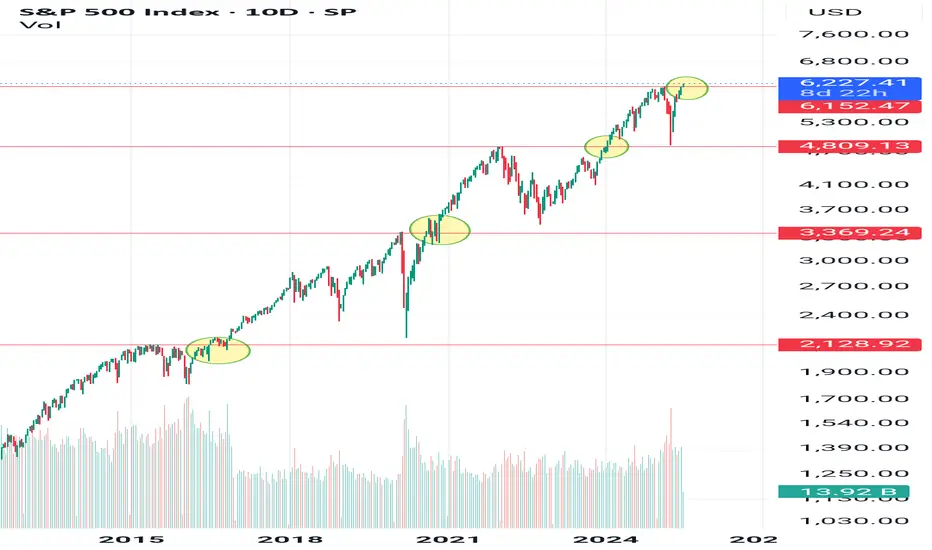
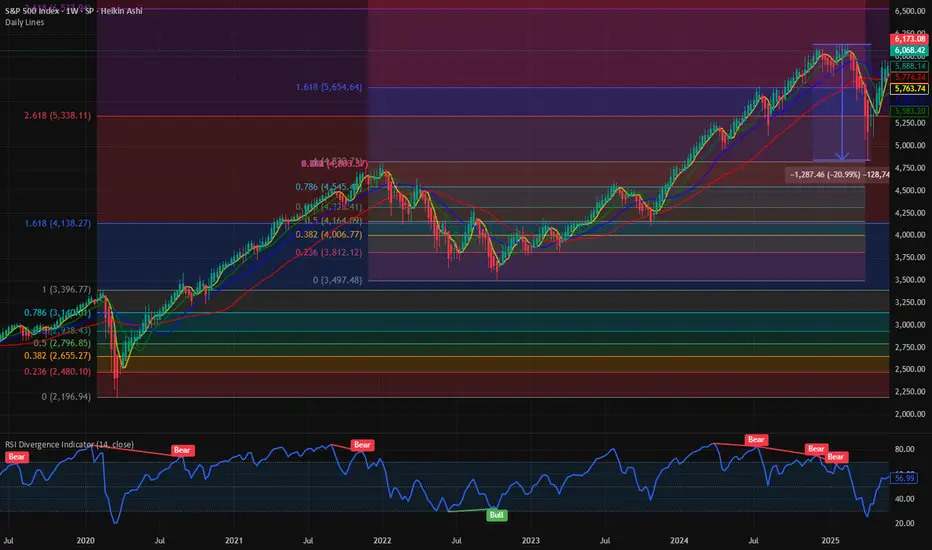
$SPX Path of least resistance is higher. Next Stop : 6500 This week we officially recovered all the losses from the liberation day low. We had a 20% bear market crash and since then there has been a V shaped rally in the major averages. NASDAQ:QQQ and SP:SPX have fully recovered the losses and then some. It is 0% form its ATH. We have been closely following the chart of SP:SPX for the last few weeks and have marked various Fib Retracement levels and Fib Extenstion. IN my opinion the Covid lows were one of the majot drawdown moments.
If we plot the Fib Extension on the COVID highs and lows, we can clearly see the Support and Resistance zones. As per the Fib Levels the next consequential level in SP:SPX will be 6550, which is the 3.618 Fib level. That I would suggest as the path to least resistance. First, we go higher before we can see any major correction. In case of a Major correction, we get support @ 5300.
Verdict : SP:SPX goes higher first before correction. 6550 is the next stop.

Watch out for SPX500USDHi traders,
Last week SPX500USD made a gap lower but after the fill it went further up and broke the previous swing high (ATH). This could be the last wave 5 (orange) of wave 3 (red).
So next week we could see this pair go lower for a (big) correction down.
Let's see what the market does and react if it reaches the Daily bullish FVG's.
Trade idea: Wait for price come into the Daily bullish FVG's to trade longs again. At the moment price is too high to trade.
If you want to learn more about trading FVG's & liquidity sweeps with Wave analysis, then please make sure to follow me.
This shared post is only my point of view on what could be the next move in this pair based on my technical analysis.
Don't be emotional, just trade your plan!
Eduwave

Hourly SAR moved above priceThis is an earlier signal compared to the standard bearish Wolfewave entry - which is price entering back below the 1-3 line.
Here, I placed a 1:3 risk/reward ratio.
Keep in mind that there could be stop hunters just above the bear risk tolerance.
Next in line in the fractal order to mark a swing high will be the 4 hour SAR.
Standard bearish Wolfewave Target is the 1-4 line.
Alternative Targets are the Magic Lines.
Patterns can fail
Do your own due diligence.

S&P 500 Daily Chart Analysis For Week of June 27, 2025Technical Analysis and Outlook:
During the current trading week, the S&P 500 Index has predominantly demonstrated an upward trajectory, surpassing the Mean Resistance level of 6046, the Outer Index Rally target of 6073, and the critical Key Resistance threshold of 6150. Currently, the index is exhibiting a bullish trend, indicating potential movement towards the Outer Index Rally objective of 6235. However, it is essential to note that there is a substantial probability that prices may retract from their current levels to test the Mean Support at 6136 before experiencing a resurgence.
