Will key support be held or broken today?Hello friends
According to the complete analysis we conducted on this currency, we concluded that the price correction can continue with the failure of the specified support and go to lower supports, but if buyers support the price in the support area, it can have a good rise.
Note that with capital and risk management, you can buy in steps in the specified support areas and move with it to the specified targets.
*Trade safely with us*
SUIUST trade ideas

SUI analysis In this video I go through the recent bullish trend in SUI and anticipate where I think the retrace will take us for a possible long entry . I also highlight a possible short setup off of the Value area high if it comes in .
Tools used in the video TR Pocket / Fibs , Volume Profile and Pivots .
Appreciate your support any questions then please leave them in the comments
Have a great day

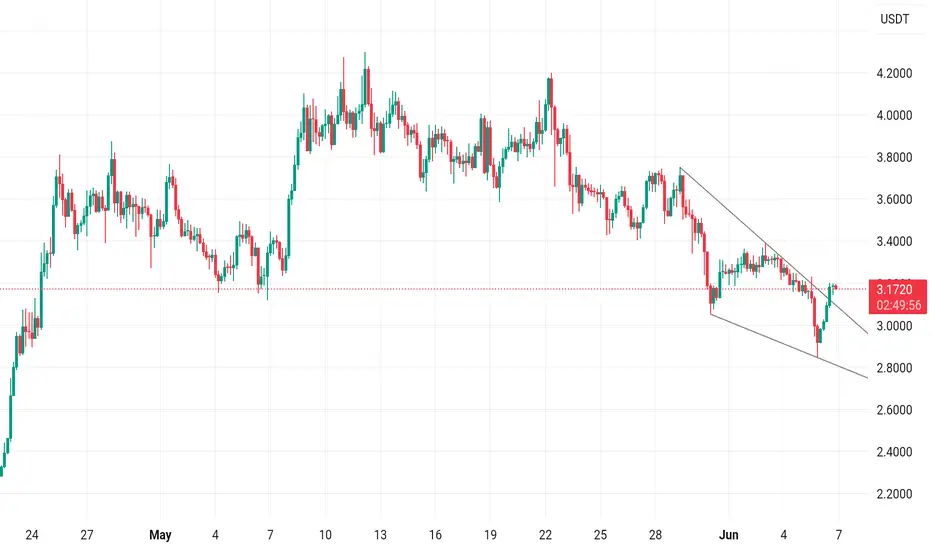
SUI/USDT – Two Scenarios in Play: Impulse or Ending Diagonal?SUI is at a key decision point on the 4H chart. The current structure may either be:
a classic impulse wave, with wave (5) still incomplete, or
a bearish ending diagonal, suggesting the uptrend is losing strength.
If this is an impulse, price could continue toward the upper boundary of the wedge to complete wave (5).
However, if this is an ending diagonal, a sharp breakdown could target the support zone around $2.93, near wave (2).
📌 Stay cautious until a breakout or breakdown confirms the direction.
🕰️ Timeframe: 4H (Binance)
📉 Key support: $2.93

SUI – Multi-Timeframe Support TestCRYPTOCAP:SUI COINBASE:SUIUSD BINANCE:SUIUSDT
🟣 CRYPTOCAP:SUI is re-testing a major weekly channel support near $3.15. A strong defense here could trigger a solid bounce 🚀.
📊 Meanwhile, on the 4H timeframe, price is holding a crucial horizontal support.
👀 Stay alert — whether it breaks down or reverses, it could be a big move ahead!


Last bounce for the weekStill have today and Tomorrow to close out the week so hopefully it will be clean and close in our direction. 3 weeks of breakout, Monday triggered the other direction but Wednesday started to go down and in Friday it became 3 days of breakout to the low . Saturday’s Asia open above yesterday’s session lowest high , pull back into it and I got an entry. 3 weeks of breakout + 3 day of breakout+ session turnover. Let see what happen. Either hit my SL or today closes in profit and I move stop to break even , the maximum hold is next Monday’s Asia open


Long SUISUI has formed an accumulation pattern based on the Wyckoff method. The Sign of Strength (SOS) phase appears to be complete, and SUI is now trending higher
Long setup is as in chart.
Disclaimer:
This analysis is based on my personnal views and is not a financial advice. Risk is under your control.

Current market updateWe’re seeing multiple setups across many altcoins — but one of the best right now is on SUI.
The major trend reversal zone and the bearish target region are overlapping, giving us a high-probability setup.
Those who position themselves well in altcoins now will be happy in the coming days and weeks :)


SUI Collapse Incoming? Bearish Pattern You Can’t IgnoreYello, Paradisers! Is #SUI about to enter a bearish spell? We’ve seen this setup many times before, and the warning signs are stacking up fast. If you're not already positioned or protecting capital, now’s the time to pay attention.
💎SUIUSDT has started losing momentum just as a classic head and shoulders pattern has completed at the top, a formation often associated with trend reversals. This bearish structure is further validated by the presence of bearish divergence on momentum indicators, hinting at exhaustion from buyers and growing strength among sellers.
💎#SUIUSDT's neckline support at $3.60 has been breached, and since then, price has been sliding gradually. Right now, its on a path toward the $3.00 level, a moderate support area where some initial profit-taking may occur. However, according to the structure's full pattern target, the move is likely not over just yet.
💎Given the weakening market dynamics and lack of bullish follow-through, an extended dip cannot be ruled out. If sellers manage to overwhelm the $2.65 floor, the next potential landing zone would be around $2.30, a high-confluence level with a strong historical order block. This is a zone where a more meaningful bounce or even a longer-term reversal could initiate, but only if market sentiment finds footing.
💎On the other side, bulls face an uphill battle. They must reclaim the $3.65 to $3.80 resistance range, a zone that has consistently rejected upward attempts over the past several days. A breakout above this range would be the first sign of renewed bullish intent and could help ease the selling pressure.
Paradisers, strive for consistency, not quick profits. Treat the market as a businessman, not as a gambler.
MyCryptoParadise
iFeel the success🌴

#SUIUSDT: A Swing Buy In Making, Get Ready For Big MoveThis cryptocurrency pair is currently undergoing consolidation, and we’re observing a shift in price momentum. A substantial volume could enter the market at any moment. Two potential reversal zones exist where significant volume could emerge and potentially push the trading price above $8. We’ve also positioned two take profit targets in conjunction with these zones.
It’s important to remember that trading or investing in financial markets carries significant risks to your capital. We don’t guarantee that the price will move precisely as described.
Prioritise safe trading practices. If you’d like to show your support, you can like, comment, or share our ideas.
Team Setupsfx_


Sui (SUI): Possible Pump Incoming | Bullish TrendSui coin is having smaller correctional movement while still holding bullish momentum inside the trend. Just like on 25th of October we are seeing correctional movement, which might turn into a big bullish movement so we are keeping eyes on EMAs and as long as we are above them, we are keeping that bullish sentiment
Swallow Academy

SUI/USDT spot (Buy Signal - Daily)📌 SUI/USDT (1D) Summary
Trend: Starting to turn bullish after a long downtrend
Buy Zone: Around 3.49 USDT
Targets (TP):
TP1: 3.68 USDT
TP2: 4.80 – 5.08 USDT
Stop Loss (SL): Below 3.05 USDT
Potential Profit: Up to +37%
Potential Loss: Around -12%
✅ Bullish Signs:
Price bounced from buy zone
Strong volume
⚠️ Risk:
Trend may fail if price breaks below 3.20

SUI/USDT is Nearing an Important Support!!Hey Traders, in today's trading session we are monitoring SUI/USDT for a buying opportunity around 3.2460 zone, SUI/USDT is trading in an uptrend and currently is in a correction phase in which it is approaching the trend at 3.2460 support and resistance area.
Trade safe, Joe.

#SUI/USDT#SUI
The price is moving within a descending channel on the 1-hour frame, adhering well to it, and is heading for a strong breakout and retest.
We are experiencing a rebound from the lower boundary of the descending channel, which is support at 3.40.
We are experiencing a downtrend on the RSI indicator, which is about to break and retest, supporting the upward trend.
We are looking for stability above the 100 Moving Average.
Entry price: 3.70
First target: 3.81
Second target: 3.91
Third target: 4.09

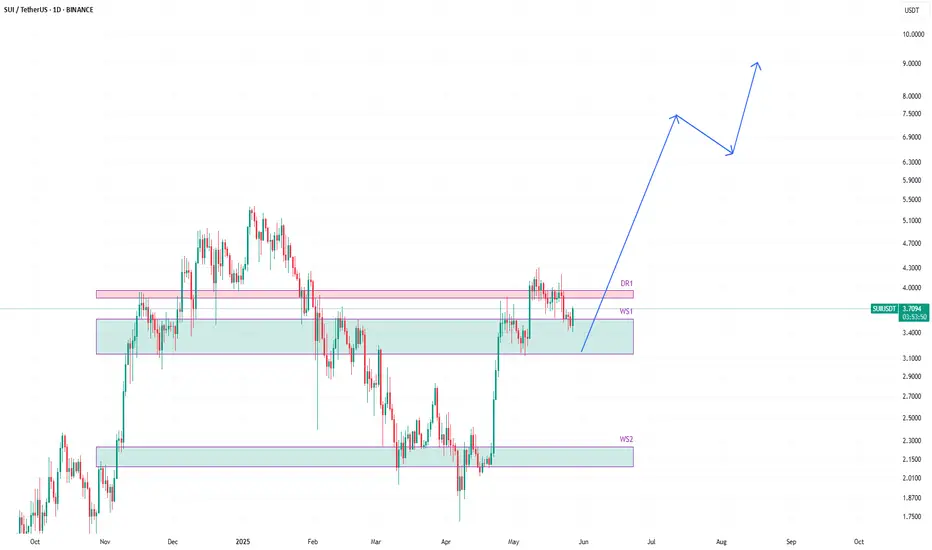
SUIUSDT likely to head higher towards 9$SUIUSDT is very bullish. I think this is just a pullback on this upward journey that it started at the begninning of april 2025.
The price is currently trading around weekly support WS1. It is possible that it might retrace further, but upward journey for this one in coming weeks in highly likely.
A good bounce from weekly support, we can already witness, and this could be the start of the journey already.
But as mentioned before, some further retracement before resuming upwards joeuney cannot be ruled out.
I am slowly adding this one as I am pretty confident that this one is going to do well in the coming weeks/months.
What do you think?
Weekly trading plan for SUIIn this idea I marked the important levels for this week and considered a few scenarios of price performance
Write a comment with your coins & hit the like button and I will make an analysis for you
The author's opinion may differ from yours,
Consider your risks.
Wish you successful trades ! mura

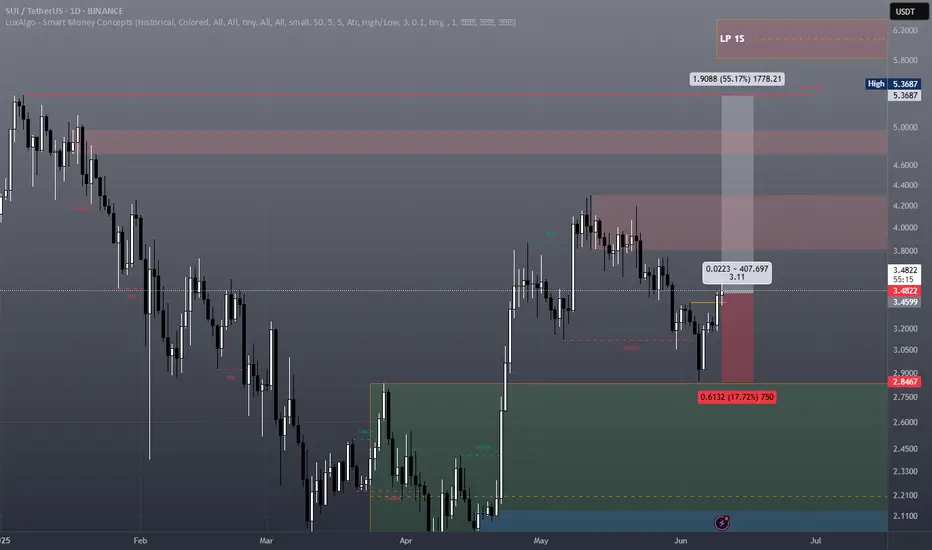
Failed Wedge, New Setup. Is SUI About to Break Out?In my previous post about BYBIT:SUIUSDT , I mentioned a potential falling wedge pattern. However, the breakout above the 4.0040 resistance turned out to be a false breakout, and the price eventually dropped to the invalidation level at 3.5868. This made the setup invalid.
But despite the failed wedge breakout, BYBIT:SUIUSDT remains in a bullish trend overall. During the current consolidation, the price appears to be forming a new bullish pattern — a Descending Broadening Wedge (DBW).
This pattern typically starts with low volatility and gradually widens. Once price reaches its lower boundary, it often experiences a strong breakout to the upside.
Let’s break down the key price action in this DBW setup:
Price is moving within a Descending Broadening Wedge and is currently near the lower boundary of the pattern.
It’s also sitting around a key support level at 3.4833.
A rejection candle formed right at 3.4833, showing the market’s response to this support area.
A reversal confirmation would come if the price breaks above 3.6102.
A bullish divergence is also visible — price is forming lower lows, while the stochastic indicator is forming higher lows.
Based on these five price action signals, it seems that buyers are still in control, even though short-term volatility has created a series of lower lows.
That’s why I still believe BINANCE:SUIUSDT has more room to go up. What’s your take on this?

