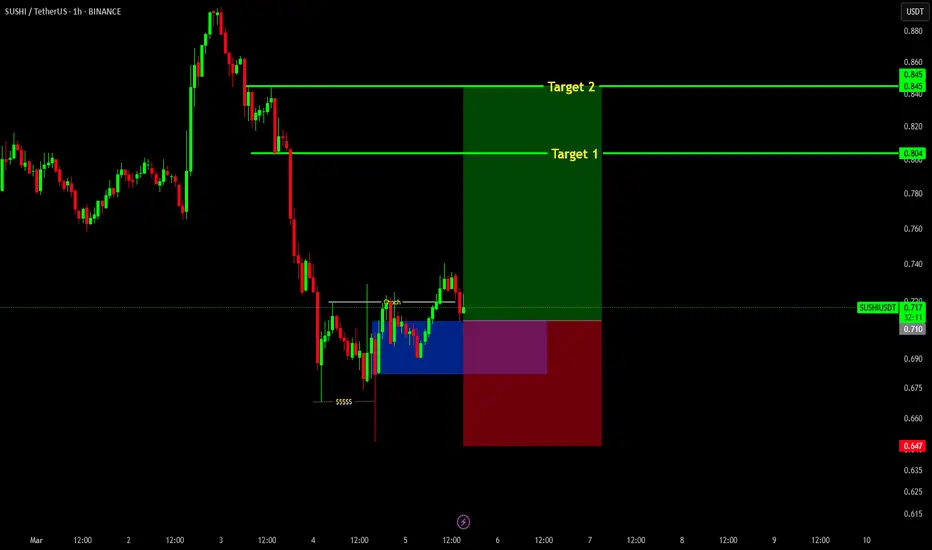
Sushi long trade setupSushi recently on 1hr time frame gave a proper ChOCh which is a bullish setup.
Entry region marked (blue box)
Stoploss at 0.647
Targets: 0.805, 0.845
SUSHIUSDT.PS trade ideas
Short trade
1Hr TF overview
Sellside trade
Sat 8th March 25
6.00 pm
Tokyo Session PM
Structure/Day
Entry 4Hr TF
Entry 0.6715
Profit level 0.5840 (13.03%)
Stop level 0.6794 (1.18%)
RR 11.08
Reason: Observing price action, the Day TF seemed indicative of a Sellside trade using the narrative of supply and demand for overall direactional bias.

volume is normal runIt is trading with a great volume to market value ratio, the volume is heading in the right direction and the chart is healthy, if the market wants to go up this currency has a healthy chart.

TradeCityPro | SUSHI: Key Levels and Market Outlook👋 Welcome to TradeCity Pro!
In this analysis, I want to review SUSHI for you. SushiSwap is a DeFi protocol operating in the DEX sector, with its token currently ranked 195th on CoinMarketCap and a market cap of $58 million.
📅 Weekly Timeframe
On the weekly timeframe, we can see a consolidation box between $0.534 and $1.959. Since 2022, the price has been fluctuating within this range, forming a large consolidation zone, with multiple touches to both the upper and lower boundaries of this box.
🔍 As observed, in the last bullish leg, the price broke above the box's upper boundary with a large weekly candle. However, it quickly retraced back into the range after being rejected at $2.734, resulting in a fake breakout.
🧩 Currently, the price is near the lower boundary of the range at $0.534. If this support level breaks, the price could initiate another bearish leg and move toward a new all-time low (ATL). On the other hand, if the upper boundary of the box is broken and price stabilizes above it, we could see an upward movement in SUSHI.
⚡️ The largest and most significant resistance ahead is at $20.444, which is the all-time high (ATH). Reaching this level would be extremely difficult, as it would require a significant increase in market capitalization, meaning a substantial capital inflow into the coin.
✨ Let’s now analyze the daily timeframe to gain more insight into price movement.
📅 Daily Timeframe
On the daily timeframe, as seen in the last bullish leg, the price bounced from the $0.534 support and moved upward. After breaking $0.803, strong bullish momentum entered the market. Additionally, RSI reaching the oversold zone contributed to a stronger bullish push.
🔽 Following this movement, the fake breakout at $1.855 led to the start of a corrective and bearish phase, with the price initially declining to $1.347.
📊 After breaking below $1.347 and retesting it as resistance, the price entered another bearish leg, reaching $0.803. Currently, after some range-bound movement around this level, RSI has exited the oversold zone, and the price seems to be retesting this level as resistance.
✅ If RSI re-enters the oversold zone, the price could drop further to the lower boundary of the range at $0.534, which would not be a good sign for SUSHI. As observed, buying volume has significantly decreased, and most traders in this market are sellers.
🛒 For spot buying, I recommend avoiding this coin for now and waiting for a clear bullish structure to form. At a minimum, SUSHI should start showing strength against Bitcoin.
🧲 From a USDT perspective, if the upper boundary of the range ($1.855) breaks, then $2.734 could serve as a trigger for a buying opportunity.
📝 Final Thoughts
This analysis reflects our opinions and is not financial advice.
Share your thoughts in the com

UNIVERSOFSIGNALS| SUSHI: Key Levels and Market Outlook👋 Welcome to UNIVERSOFSIGNALS !
In this analysis, I want to review SUSHI for you. SushiSwap is a DeFi protocol operating in the DEX sector, with its token currently ranked 195th on CoinMarketCap and a market cap of $58 million.
📅 Weekly Timeframe
On the weekly timeframe, we can see a consolidation box between $0.534 and $1.959. Since 2022, the price has been fluctuating within this range, forming a large consolidation zone, with multiple touches to both the upper and lower boundaries of this box.
🔍 As observed, in the last bullish leg, the price broke above the box's upper boundary with a large weekly candle. However, it quickly retraced back into the range after being rejected at $2.734, resulting in a fake breakout.
🧩 Currently, the price is near the lower boundary of the range at $0.534. If this support level breaks, the price could initiate another bearish leg and move toward a new all-time low (ATL). On the other hand, if the upper boundary of the box is broken and price stabilizes above it, we could see an upward movement in SUSHI.
⚡️ The largest and most significant resistance ahead is at $20.444, which is the all-time high (ATH). Reaching this level would be extremely difficult, as it would require a significant increase in market capitalization, meaning a substantial capital inflow into the coin.
✨ Let’s now analyze the daily timeframe to gain more insight into price movement.
📅 Daily Timeframe
On the daily timeframe, as seen in the last bullish leg, the price bounced from the $0.534 support and moved upward. After breaking $0.803, strong bullish momentum entered the market. Additionally, RSI reaching the oversold zone contributed to a stronger bullish push.
🔽 Following this movement, the fake breakout at $1.855 led to the start of a corrective and bearish phase, with the price initially declining to $1.347.
📊 After breaking below $1.347 and retesting it as resistance, the price entered another bearish leg, reaching $0.803. Currently, after some range-bound movement around this level, RSI has exited the oversold zone, and the price seems to be retesting this level as resistance.
✅ If RSI re-enters the oversold zone, the price could drop further to the lower boundary of the range at $0.534, which would not be a good sign for SUSHI. As observed, buying volume has significantly decreased, and most traders in this market are sellers.
🛒 For spot buying, I recommend avoiding this coin for now and waiting for a clear bullish structure to form. At a minimum, SUSHI should start showing strength against Bitcoin.
🧲 From a USDT perspective, if the upper boundary of the range ($1.855) breaks, then $2.734 could serve as a trigger for a buying opportunity.
📝 Final Thoughts
This analysis reflects our opinions and is not financial advice.
Share your thoughts in the com

SUSHIUSDTRisk warning, disclaimer: the above is a personal market judgment based on published information and historical chart data on Tradingview, all analysis is only subjective. Hope investors consider, that I am not responsible for your investment decision.
Thank you.
Good luck
#SUSHI/USDT#SUSHI
The price is moving in a descending channel on the 1-hour frame and is expected to continue upwards
We have a trend to stabilize above the moving average 100 again
We have a descending trend on the RSI indicator that supports the rise by breaking it upwards
We have a support area at the lower limit of the channel at a price of 0.850
Entry price 0.897
First target 0.924
Second target 0.947
Third target 0.980

SUSHI Swing Buy OpportunityI'm considering adding another altcoin, SUSHI, to my spot portfolio. Beyond its strong utility fundamentals, the coin has been consolidating within a range for nearly three years and appears to be forming a higher low. I like its potential and am gradually building my position through DCAing, aiming to target the previous highs while taking profits along the way. Let me know your thoughts!

#SUSHI Holders, Beware: A Major Move Is Brewing in the EcosystemYello Paradisers! Have you been watching #SUSHIUSDT? If not, now’s the time to pay attention. #SushiSwap is approaching a critical point that could spark a bullish breakout:
💎#SUSHI has completed a classic 5-wave impulsive structure, with Wave 5 peaking at around $2.80. What followed is an A-B-C corrective wave, bringing #SUSHI down to its current levels. Right now, we’re seeing Wave C testing the descending support near $0.92. The key question: Will this be the end of the correction, or is there more downside ahead?
💎For the bulls to regain control, #SUSHIUSD needs to break above the $1.356 resistance. A solid breakout here could trigger a rally towards $1.80, and if momentum holds, a push into the strong resistance zone between $2.60 and $2.80. However, if #SUSHI fails to clear this hurdle, expect more sideways action or even a retest of lower levels.
💎On the downside, we have strong support at $0.70. This strong support has held many times more and we believe buyers will setup in to defend this level. The next line of defense for the bulls is present at $0.60.
💎If a candle closes below this level, the bullish setup is invalidated, and we could see a sharp decline towards $0.40 or even lower. This would mark a failure of the corrective structure, leading to a deeper bearish trend.
Stay focused, patient, and disciplined, Paradisers🥂
MyCryptoParadise
iFeel the success🌴

SUSHIUSDT 1WSUSHI ~ 1W Analysis
#SUSHI This is the lowest support for now. Buy from here if you still have a Conviction on this coin with a minimum target of 20%+.


SUSHI looks great, Done with EW second (correction) wave. SUSHI looks great, Done with EW second (correction) wave. Preparing to wave 3.

sushi buy spot"🌟 Welcome to Golden Candle! 🌟
We're a team of 📈 passionate traders 📉 who love sharing our 🔍 technical analysis insights 🔎 with the TradingView community. 🌎
Our goal is to provide 💡 valuable perspectives 💡 on market trends and patterns, but 🚫 please note that our analyses are not intended as buy or sell recommendations. 🚫
Instead, they reflect our own 💭 personal attitudes and thoughts. 💭
Follow along and 📚 learn 📚 from our analyses! 📊💡"

Is SUSHIUSDT About to Bounce or Break? Yello, Paradisers! SUSHIUSDT is setting up an intriguing scenario after reacting to a key resistance trendline. Let’s break this down:
💎If SUSHIUSDT shows a bullish I-CHoCH (Internal Change of Character) from the key support zone—previously a resistance level—it could signal a higher probability of a bounce. However, patience is key here; we need to wait for confirmation of a bullish I-CHoCH on lower timeframes to take action.
💎On the flip side, if the price experiences further drops or shows signs of panic selling, the best approach would be to wait for it to reach a stronger support zone. At that point, we’d need to look for bullish patterns such as A W formation or An Inverse Head and Shoulders on lower timeframes to stack the odds in our favor.
💎If the price breaks down and closes a candle below the strong support zone, it will invalidate the bullish thesis entirely. In that case, it’s smarter to wait for a clearer structure to develop before considering any entries.
🎖 Remember, Paradisers, disciplined trading is the only way to achieve long-term success. Avoid impulsive decisions and always prioritize confirmation over speculation. The market rewards patience and preparation—stay sharp, stay focused.
MyCryptoParadise
iFeel the success🌴

SUSHIUSDT: Descending Triangle or Breakout Setup?SUSHI is consolidating in a descending triangle, a pattern that often leans bearish. However, the context of the broader market may favor a bullish breakout instead.
Observation: The consistent higher volume at recent supports suggests buyers are still active.
Volume Dynamics: A steady decline in volume aligns with consolidation, but a decisive move—confirmed by volume expansion—is critical.
Question: Do you think the declining volume supports the idea of a breakout, or does it suggest bearish exhaustion?
Fibonacci Levels: The Fibonacci retracement zones highlight key levels to watch for both bullish and bearish scenarios. The price is currently hovering near mid-level retracement, a pivotal area for decision-making.
Indicators:
RSI: Near neutral, neither overbought nor oversold, leaving room for price action in either direction.
MACD: Signs of flattening momentum but no clear crossover yet. Could the next bar indicate a direction?
ADX/DMI: Lack of a strong trend hints that a breakout will define the next phase.
Trade Plan:
Bullish Scenario: A break above the descending resistance line, backed by increasing volume, could push the price toward the next resistance zones.
Bearish Scenario: A breakdown below support may trigger a sharp move lower toward prior structural lows.
Risk Management: Stop-loss near recent support ensures a well-balanced risk-reward setup.
Questions:
Is the descending triangle pattern valid, or do you see this as a potential reversal setup?
How do you use volume spikes to confirm breakouts in similar charts?
Are Fibonacci retracement levels a strong confluence for your entries and exits?
Conclusion:
SUSHI is at a decision point. With price compressing in a tight range, a breakout or breakdown is imminent. A decisive move will likely set the tone for the next significant trend.
Watch the live analysis video for deeper insights, and drop your thoughts below. Would you trade this setup? Let’s discuss your strategy!


Dont Fade on SushiSushi high time frame
- Double bottom
- Breaking trendline on log chart
this is insane one of most hate DEX on most hate chain (ETH) is playing greate

SUSHIUSDT 1WSUSHI ~ 1W
#SUSHI So far it continues to maintain its bullish structure. Buy in stages from here. with a minimum target of 20%++

#SUSHI/USDT Ready to go higher#SUSHI
The price is moving in a descending channel on the 1-hour frame and sticking to it well
We have a bounce from the lower limit of the descending channel, this support is at a price of 1.37
We have a downtrend on the RSI indicator that is about to be broken, which supports the rise
We have a trend to stabilize above the moving average 100
Entry price 1.45
First target 1.58
Second target 1.73
Third target 1.89

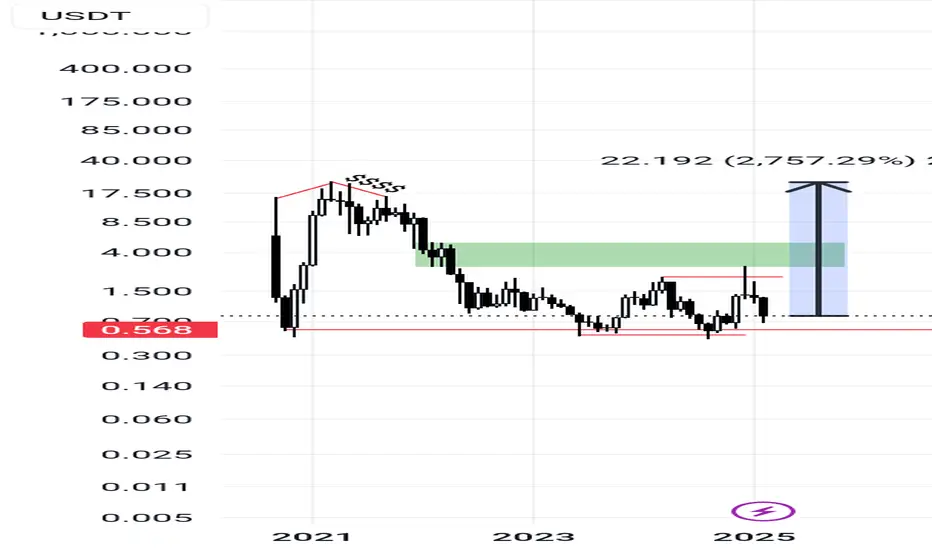
Sushi: A Plan for the Upcoming AltseasonThe SushiSwap (SUSHI) token has an interesting story heading into the next altseason. While many tokens avoided updating their historical lows, BINANCE:SUSHIUSDT stands out as one of the few that broke below its November 2020 low—proving that in crypto, never say never!
The levels we’ve outlined suggest that SUSHI is trading within a clear accumulation zone.
A continuation of the uptrend appears likely, targeting the green block region.
Market Capitalization Targets
SUSHI's previous high market capitalization reached $3.5 billion, aligning with the green block level. This could act as a mid-term target for the upcoming cycle.
If you believe in SUSHI breaking into uncharted territory, the higher targets have been marked for reference.
The largest purchases by major players were highlighted on the monthly timeframe.
This institutional activity strongly supports the potential for a significant upward movement.
Accumulation near the current levels aligns with both technical and market sentiment indicators.
Mid-term traders could consider targeting the $3.5 billion market cap level, while long-term holders can set their sights on a potential new ATH.
Hope you enjoyed the content I created! You can support this idea with your likes and comments so more people can see it.
✅ Disclaimer: Please be aware of the risks involved in trading. This idea was made for educational purposes only, not for financial investment purposes.
Check out my ideas about interesting altcoins in the related section below ↓
For more ideas, please hit "Like" and "Follow"!

SUSHI/USDTKey Level Zone : 1.710 - 1.730
HMT v3.1 detected. The setup looks promising, supported by a previous upward/downward trend with increasing volume and momentum, presenting an excellent reward-to-risk opportunity.
HMT (High Momentum Trending):
HMT is based on trend, momentum, volume, and market structure across multiple timeframes. It highlights setups with strong potential for upward movement and higher rewards.
Whenever I spot a signal for my own trading, I’ll share it. Please note that conducting a comprehensive analysis on a single timeframe chart can be quite challenging and sometimes confusing. I appreciate your understanding of the effort involved.
Important Note :
Role of Key Levels:
- These zones are critical for analyzing price trends. If the key level zone holds, the price may continue trending in the expected direction. However, momentum may increase or decrease based on subsequent patterns.
- Breakouts: If the key level zone breaks, it signals a stop-out. For reversal traders, this presents an opportunity to consider switching direction, as the price often retests these zones, which may act as strong support-turned-resistance (or vice versa).
My Trading Rules
Risk Management
- Maximum risk per trade: 2.5%.
- Leverage: 5x.
Exit Strategy
Profit-Taking:
- Sell at least 70% on the 3rd wave up (LTF Wave 5).
- Typically, sell 50% during a high-volume spike.
- Adjust stop-loss to breakeven once the trade achieves a 1.5:1 reward-to-risk ratio.
- If the market shows signs of losing momentum or divergence, ill will exit at breakeven.
The market is highly dynamic and constantly changing. HMT signals and target profit (TP) levels are based on the current price and movement, but market conditions can shift instantly, so it is crucial to remain adaptable and follow the market's movement.
If you find this signal/analysis meaningful, kindly like and share it.
Thank you for your support~
Sharing this with love!
HMT v2.0:
- Major update to the Momentum indicator
- Reduced false signals from inaccurate momentum detection
- New screener with improved accuracy and fewer signals
HMT v3.0:
- Added liquidity factor to enhance trend continuation
- Improved potential for momentum-based plays
- Increased winning probability by reducing entries during peaks
HMT v3.1:
- Enhanced entry confirmation for improved reward-to-risk ratios

Long trade
15min TF overview
Pair SUSHIUSDT
Buyside trade 2
Fri 3rd Jan 25
6.00 am
Tokyo to LND Session AM
Entry 1.4785
Profit level 2.2573 (52.86%)
Stop level 1.4408 (2.55%)
RR 20.66
The thought process for buyside trade:
Price reached a critical price level along with buyside momentum observed on the 5nin TF. As well as seeing BTCUSDT play out to the buyside on the 30th of December 24, I assumed it was a reflection of directional bias and influence on this occasion for a buyside trade with SUSHIUSDT.
