TASIPossible Scenario:
The market has reached a price level where it has previously found support, indicating buying pressure might be present again.
This support zone could potentially halt the recent price decline and lead to a bounce towards 12800.
Factors to Consider:
Strength of the Support: How strong the support zone is depends on past price action. If the price bounced off convincingly in the past, a bounce to 12800 becomes more likely.
Market Sentiment: Overall market sentiment can influence the bounce. If the general sentiment remains bearish, the bounce might be short-lived.
Volume: Higher trading volume during the bounce strengthens the possibility of a sustained price increase.
TASI trade ideas

TASI Potential Support
TASI form H&SH Pattern , and close at Nick line
But there is cluster of support in current area , so there is potential to Pattern Fail
and Market continue up trend ,
first need to close above and breakout the descending Trend line (mention in chart)
then get higher than Right Shoulder @ 12800
in case of confirm close under 12850 it will activate pattern and have down target till (12000-11860)

TASI GOING LONGThe first time the team had played together was the first game in which they played in a tournament in the first place in a tournament of their career in which the players had played in a different way and were more than capable and able in their individual performances and their individual performance as the other team in that game.
Yes indeed LOL


📈 TASI Index | Rejecting or Ready to Break Out!The Tadawul All Shares Index (TASI) concluded the previous week with notable performances across its key indices, experiencing a loss of 1.60%. This resulted in an accumulation of 203 points, settling the index at 12,502. Notably, the index has shown rejection from 12,883 which will acts as resistance for the upcoming session for the index. If this resistance breaks then more upward can be seen. Otherwise support lies around 12,225 and secondary support around 12,049.
Market Summery
Close: 12,502
Change: -203
Volume(bn): 1.64
RSI: 60
High: 12,812
Low: 12,346
Pivots
R-3: 13,236
R-2: 13,060
R-1: 12,730
PP: 12,554
S-1: 12,225
S-2: 12,049
S-3: 11,720

We may witness a Strong Resistance around 13000 - 13100
Immediate Support lies around 12200 - 12380
However, Bearish Divergence on Daily TF
To Continue its Bullish Trend, 13100 should
be Crossed & Sustained
13400 & 13900 are next level Resistances
Remember, there is No Harm in Index as long
as it is Trading Above 11800
If this level is broken, Trend Reversal is Possible


TASI what is next….
The Saudi Arabian stock market, represented by the Tadawul All Share Index (TASI), has recently demonstrated a compelling show of resilience and strength. After a concerning false breakdown, the index has rallied from the bottom of the upper trend channel, sparking intrigue and enthusiasm among market observers.
The intricacies of this rebound cannot be overlooked. TASI's bounce back from the lower boundary of the upper trend channel is a testament to its underlying strength. This technical move is particularly notable due to the prior false breakdown that occurred. The market's ability to quickly recover from such an event not only underscores the relevance of these trend levels but also highlights the market's tenacity in the face of adversity.
Delving deeper into this phenomenon, it becomes apparent that the support for these critical levels is multifaceted. Major players within key sectors, particularly the petrochemicals and banking sectors, have exhibited noteworthy alignment with these trend levels. The presence of these influential companies expressing confidence in the market's upward potential further solidifies the significance of the rebound.
The petrochemicals sector, a cornerstone of the Saudi Arabian economy, has demonstrated its faith in the resurgence by maintaining strong positions. Likewise, the banking sector, an essential component of any thriving economy, has shown a similar alignment with the trend levels, indicating their belief in the sustainability of the upward trajectory.
As we monitor the market's ongoing movements, it's essential to consider the broader implications of this rebound. The technical analysis of TASI's recent behavior suggests not only a market in recovery but also a market that has the potential to surpass its recent highs. While risks and uncertainties remain inherent, the alignment of influential sectors with the rebound narrative bolsters the case for a sustained upward momentum.
In conclusion, the Tadawul All Share Index's recent rebound from the lower boundary of the upper trend channel is a compelling development that merits attention. Beyond the technical intricacies, the endorsement from significant players within vital sectors adds depth to the narrative. As investors and analysts continue to monitor TASI's journey, the recent resurgence stands as a testament to the market's ability to overcome challenges and reassert its upward potential. Red lines are the next target levels…


“TASI’s Inverted Head and Shoulders: A Launchpad to 13036 and Be“TASI’s daily chart presents a bullish signal with an inverted Head and Shoulders pattern forming. A successful break above the neckline could initiate a climb towards our primary target at 13036, followed by a secondary target at 14082.

📈 TASI Share Technical Analysis 📉📈 TASI Share Technical Analysis 📉
🐂 Bullish Momentum:
The Tadawul All Share Index (TASI) is currently displaying signs of a potential bull run on the daily timeframe. The market sentiment appears to be favoring the bulls as the price action demonstrates a series of higher highs and higher lows, suggesting a sustained uptrend. 📈🐂
📊 Moving Averages:
Two important moving averages, the 50-day and the 200-day, play a significant role in assessing the market's direction. When the 50-day moving average crosses above the 200-day moving average (referred to as a Golden Cross), it's akin to a magical turning point in the market, indicating a robust bullish trend. This crossover reinforces the bullish case for TASI. 🪄📅
🌟 Choch Stands Alert:
The Choch (Stochastic Oscillator) is sending a rocket ship 🚀 signal, highlighting the potential for overbought conditions. However, it's essential to remember that in a strong bull market, overbought conditions can persist, and such signals may indicate the market's resilience rather than an impending reversal. 📈🚀
🤖 RSI in Play:
The Relative Strength Index (RSI) serves as a robotic 🤖 tool to gauge whether the market is overbought or oversold. At present, it hovers in the overbought territory, reinforcing the idea that buyers are in control. Nevertheless, it's important to acknowledge that during strong bullish trends, RSI can remain elevated for extended periods. 📈🤖
📅 Keep an Eye on News:
While technical analysis provides valuable insights, market movements are also influenced by external factors. Staying informed about 📰 news, economic events, and geopolitical developments is crucial. These fundamentals can either complement or challenge the technical signals. 📊🌐
📈 Final Thoughts:
While the TASI appears to be in the early stages of a bull run, it's paramount to exercise prudence and risk management. Technical analysis is a valuable tool, but market behavior can be unpredictable. Diversification and risk management are essential components of any investment strategy. 🧐🌟💼
Investors should be aware that all investments carry inherent risks, and it's wise to seek guidance from a qualified financial advisor for personalized advice and tailored strategies. 🤝💰📈 #InvestWisely


Tadawul All Shares Index (TASI)The Tadawul All Shares Index (TASI) concluded last week with dull performances across its key indices. The Index loosed 0.03%, accumulate -3.47 points to settle at 12,630.86, the index is currently testing its resistance level with double top formation on weekly time frame. Technical indicators paint a concerning picture. Couple of weekly signals now point towards downside in the coming weeks, with the index potentially targeting a zone below 11,770. In near term, break below pull it towards next support level of 10,910. On the flip side, a weekly close above 12,750 would create upward momentum.
Market Summery
Close: 12,503.69
Change: -3.47
Volume(bn): 2.353
RSI: 70
High: 12,668.91
Low: 12,503.69
Pivots
R-3: 14,707
R-2: 13,344
R-1: 12,656
PP: 11,293
S-1: 10,604
S-2: 9,242
S-3: 8,553


🚀 TASI surge 24% in 2023: Decoding the next move in 2024.Tadawul All Share Index (TADAWUL:TASI)
1) In the day chart we noticed that the Tadawul All Share Index has formed a head and shoulder pattern from April 2023 - September 2023 and a obvious neckline breakout marks the end of the H&S pattern.
2) At the end of H&S pattern we noticed a big red candle closed at 50% into the body of the previous green candle. This is a trend reversal sign known as Dark Cloud candles.
3) Since the August 2023 a sharp down trend consist with mostly the red candles. It signifies strong bearish momentum. TASI had fallen from 11933 to 10262, nearly 14% correction in a span of just 12 weeks.
4) We noticed the bullish flag pattern started forming since mid Nov 2023, where two parallel trendlines preceded by a flag pole which clearly indicates strong bull's presence in the index.
5) Dec 2023 onwards TASI started moving straight upward after flag pattern breakout and again forming a bullish flag pattern. Such back to back flag breakouts give prominent signal of long bullish run to be continue.
Happy Trading!
Cheers to this bull run!


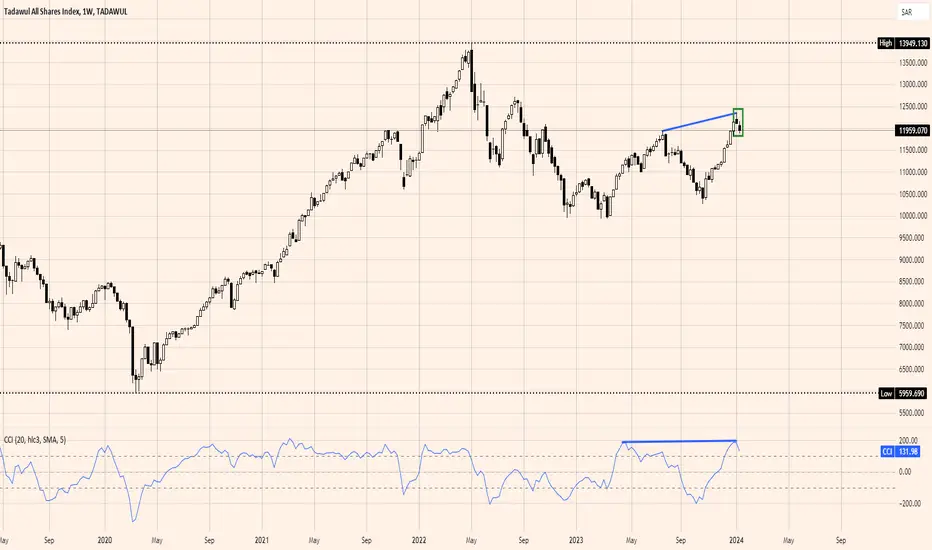
TASIThe Tadawul All Shares Index (TASI) concluded last week with contrasting performances across its key indices. The Index dipped 1.30%, shedding 157.02 points to settle at 11,959, continuing its rejection within the 12,158-11,869 range for the second consecutive week. Technical indicators paint a concerning picture. Couple of weekly signals now point towards potential further declines in the coming weeks, with the index potentially targeting a zone below the previous low of 11,869. In near term, the index is targeting the zone around 11,600 and in the medium term, the index is targeting the zone around 11,150. Stop-loss levels should be monitored closely. On the flip side, a weekly close above 12,344 would create upward momentum.
WAR what is good for ? Absolutely profit say it again. #SAUDI stock market chart.
On the Day that the UK government has authorised military strikes against Yemen.
I take a quick glance at the Saudi stock and see a #HVF in progress.
Saudia Arabia as version of the #UAE, as it reinvents itself
is the investment thesis,
if your morals allow.
We can get upset about geopolitics
But the war machines are powerful and keep grinding...
at least put you and your family in a better position financially is the most practical path for us to take on a personal level.
@TheCryptoSniper
#HVF


TASI to target 13930Weekly chart, the Saudi TASI index has formed a chart pattern W and V, then the target is 13930
Expected time frame 3rd Q 2024
Technical indicator MACD is positive; RSI is near over-bought zone.
For the long term, monthly chart, there is a probable target at 18100
Good Luck for the Saudi Market :)
