TFUELUSDT IDEAHey traders hope you are enjoying our analysis. Now we are here again with a new trading opportunity. We will discuss today about TFUEL
Falling Wedge Breaking out in 1W Timeframe✅
Expecting Bullish Wave📈
TFUELUSDT trade ideas

TFUELUSDT is BullishTFUEL is currently in a trending phase, printing higher highs and higher lows, with no divergence on RSI the trend is likely to continue. Targets are mentioned on the chart.

$TFUEL - Long Spot TradeTFUEL under accumulation for over 600 days.
TFUEL is trading above its 2020 lows = this is a bullish sign showing that the project and coin is strong (many projects went way below their 2020 lows, which shows weakness).
Trading above the 50 EMA on the Daily time frame.
When weekly candle closes ABOVE 50 EMA (purple cloud) = this is the signal that it will continue higher.
Buy whilst price is in the blue rectangle (accumulation zone).

I Cannot Short This !!! situation+next targets.Hi.
TFUEL Price shows a falling wedge breakout that has confirmed💁♂️
If resistance of the parallel channel breaks, a rally to $0.40 may happen.
❗ Note that if the channel is broken down with the power of descending candles, our analysis will fail.
🤑 Stay great my friends.
_ _ _ _ _ _ _ _ _ _ _ _ _ _ _ _ _ _ _ _ _ _ _ _ _ _ _
Thank you and for more ideas ❤️like❤️ and 🌟follow🌟!

TFUELUSDT.4HBased on the provided market data, TFUEL is currently trading at a price of $0.046 against USDT. The market data shows that the Relative Strength Index (RSI) for 4 hours, 1 day and 7 days are 63.57, 52.03 and 54.59 respectively. These values suggest that TFUEL is neither oversold nor overbought in the market currently, indicating a balanced market condition.
The Moving Average Convergence Divergence (MACD) for 4 hours and 7 days are positive, while it is negative for 1 day. This suggests that in the short term, the market is showing a bullish trend, but in the daily chart, it's showing a bearish trend.
The Bollinger Bands (Bb) for 4 hours, 1 day and 7 days are 0.047, 0.050 and 0.053 respectively. This indicates the price volatility of TFUEL, with potential for price fluctuations within these bands.
The support levels for 4 hours, 1 day and 7 days are gradually decreasing, which suggests that the price has a downward trend. However, the resistance levels are gradually increasing which indicates a potential upward trend.
In conclusion, the market for TFUEL seems to be neutral with a slight bullish bias in the short term, but bearish in the daily chart. This suggests that there might be some upward movement in the price, but also potential for downward movement. Therefore, potential investors should monitor the market closely and make decisions based on their risk tolerance and investment goals.

TFUEL ANALYSISThis symbol appears to be inside a diametric that is currently forming the F wave of this diametric. After completing the F wave, we will enter the G wave, which is the green area for buying.
For risk management, please don't forget stop loss and capital management
Comment if you have any questions
Thank You

TFUEL Rally Mode: Your Chance to Buy and Prosper!"**Short Fundamental Analysis of Theta Fuel (TFUEL)**
**Tokenomics**
- Theta Fuel (TFUEL) is the native utility token on the Theta blockchain.
- It serves multiple purposes, including:
1. **Paying relayers** for sharing their bandwidth and computing resources to distribute video content.
2. **Fueling smart contracts** and applications on the Theta blockchain.
3. **Incentivizing Edge Node operators** who share their computing resources and bandwidth to improve the network's performance.
- The total supply of TFUEL is not fixed but is subject to a gradual inflation schedule.
- TFUEL is currently ranked #142 by market capitalization and has a circulating supply of over 6.4 billion tokens.
**Recent News**
- Theta Labs, the developer of the Theta blockchain, has announced several partnerships and developments in recent months.
1. **Integration with Samsung**'s smart TVs, allowing users to stream video directly to their TVs using Theta's network.
2. **Partnership with** **Google Cloud** to explore decentralized video delivery for Google's products and services.
3. **Launch of** **Theta EdgeCast**, a decentralized content delivery network (CDN) that utilizes Theta's network to deliver high-quality video content.
**Disclaimer**
The information provided in this analysis is for informational purposes only and should not be construed as financial advice. Always conduct your own research before making any investment decisions.

TFULEUSDT IDEAHey traders hope you are enjoying our analysis. Now we are here again with a new trading opportunity. We will discuss today about TFUEL
TFUEL Seems Like Preparing For Massive Recovery In Coming Weeks MultiYear Symmetrical Triangle Breakout & Retest Has Already Confirmed Expecting 300% Bullish Rally In Coming Weeks

tfuel preparing for solid recovery in coming weeeks Seems Like Preparing For Massive Recovery In Coming Weeks MultiYear Symmetrical Triangle
Breakout & Retest Has Already Confirmed Expecting 3-4x Bullish Rally In Coming Weeks send

TFUEL USDT - BULLISH OUTLOOKTFUELUSDT is displaying a potential trading opportunity based on recent price action, with indications of a bullish trend on the 1-day timeframe and an RSI bullish divergence on the 1-hour timeframe. Here's a concise analysis and trade plan:
Entry: Consider entering a long position at the current market price (CMP) of $0.44.
Stop Loss (SL): Set the stop loss at $0.3950 to manage potential downside risk.
Take-Profit Levels:
TP 1 @ 1:1 = $0.4850.
TP 2 @ 1:2 = $0.53.
TP 3 @ 1:3 = $0.5750.
TP 4 @ 1:4 = $0.62.
TP 5 @ 1:5 = $0.6650.
After reaching the first take-profit level, consider adjusting the stop loss to the entry point (breakeven) to secure profits and minimize further risk.
This trade plan is designed to capitalize on the identified bullish trend on the 1-day timeframe and the RSI bullish divergence on the 1-hour timeframe. Managing risk through a stop loss and implementing a breakeven strategy after the first take-profit level aligns with a prudent trading approach. As always, staying informed and adapting to market conditions is crucial for successful trading.

TFUELUSDT 3M: Wave W Dynamics & Profit Potentials1Y frame:
We observe a sideways movement, indicative of a consolidating market. We've identified that waves A and B have completed, and currently, we are navigating through wave C.
6M Frame:
the current correction wave C will taking the form of a WXY pattern. We are presently in the middle of wave W
3M Frame
in this Idea we will go deeper to analysis the wave W:
wave A is completed and it was in a running flat form.
we are now in wave B which I expected to be a regulaer flat. the current candle form the second leg of this wave B and I expected beging of the next month we will go down to complete the third leg and targeting the yearly support area between 0.03333 and 0.03150, which will be our entry point.
wave C will be an 5 impluse wave which will ened around 0.11500-0.11700 with 250% profit.
failling point:
1M candle closing below the yearly support area, you can say below 0.031-0.030

TFUEL/USDT Anticipating a Bullish Turnaround from Key Support? 💎 Paradisers, focus on #TFUELUSDT as it's approaching a pivotal moment. The asset is nearing a retest of a key support level, setting the stage for a potential bullish movement.
💎 Reflecting on #ThetaFuel's recent market behavior, it has demonstrated a pattern of breaking above its descending channel and initiating upward trends. Currently, $TFUEL is revisiting its crucial support at $0.03962. There's optimism for a bullish reversal from this level, especially considering its past resilience at the same support, where it previously made an equal low before rallying.
💎 However, in the often unpredictable world of cryptocurrency, #TFUEL traders must remain prepared for various scenarios. Should It struggle to uphold its bullish trajectory from this key support and lose momentum, pivoting to a contingency plan from the lower support level of $0.03764 will be crucial.
💎 A dip below this secondary support level would signal the need for a tactical shift in strategy. Such a scenario would necessitate a reassessment of the bullish outlook and a recalibration of trading strategies in response to the evolving market dynamics. 🌴💰

TFUELUSDT IDEAHello Trading view Family / Fellow Traders.
I hope you have used and benifited from the previous analysis .
In today trading session we are monitoring TFUELUSDT for a buying opportunity...
TFUELUSDT UPDATE
Falling Wedge Upside Breakout is Already Done in 1D Timeframe..
Expecting Massive Bullish Wave.
Moving As Expecting 4O% Profit so far✍️

TFUEL/USDT next possible move? 👀 Theta Today Analysis💎 Paradisers, set your sights on TFUELUSDT! We've observed its intriguing position within a descending channel, and it appears poised for a potential breakout.
💎 For a while now, TFUEL has been tracing the contours of this descending channel. However, after a recent bounce from the channel's support, it's showing strong upward momentum and is inching closer to a breakout point.
💎 Should the price successfully breach the descending channel, we're bullish about its prospects for a substantial upward surge. On the flip side, if the price dips below the current demand zone, it's likely to revisit a crucial support level once more.
💎 Remember to employ prudent trading strategies and use proper stop-loss measures! Stay alert to market movements and look forward to more insight

Theta fuel (TFUEL) formed bullish Gartley for upto 15.50% pumpHi dear friends, hope you are well and welcome to the new trade setup of Theta fuel (TFUEL) with US Dollar pair.
Our last successful trade of TFUEL was the below one:
Now on a 2-hr time frame, TFUEL has formed a bullish Gartley move for the next price reversal.
Note: Above idea is for educational purpose only. It is advised to diversify and strictly follow the stop loss, and don't get stuck with trade.

TFUEL analysisIts not completed analize. Tfuel has a huge divergence in weekly timeframe. I can guess we have a acceptable ascent also in THETA. I think that descent of BITCOIN not making a lower price in TFUEL it can be a just like correction in upward trend
FOMC interest rate will be no change
#TFUEL #THETA #USDT #USD #BITCOIN

Tfuel Loading For Massive Bullish Rally Seems like ready for massive recovery in midterm
formed falling wedge in 3 days tf and testing trendline also expecting breakout
incase of successful breakout expecting 320 to 340% Bullish rally in midterm

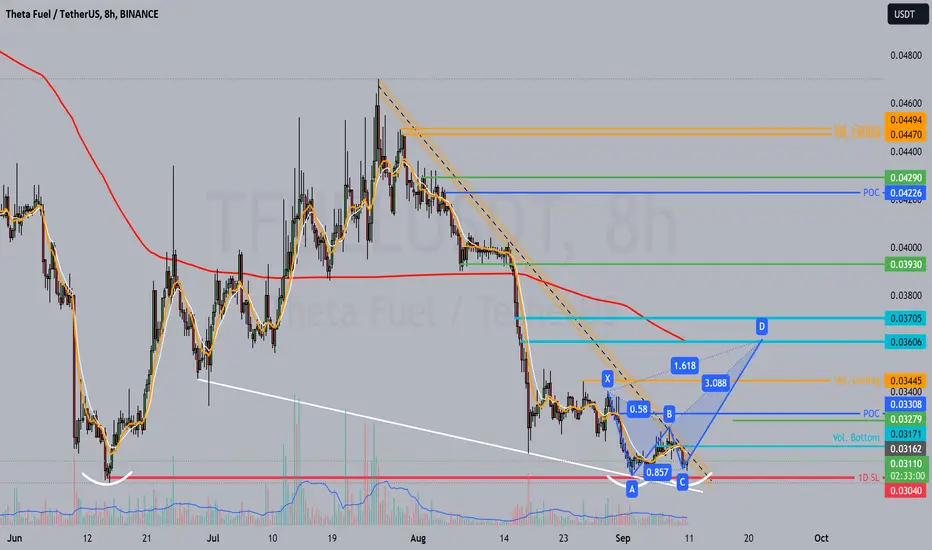
TFUEL is Bullish if...It is now trending at very narrow area and I believe it will explode if some volume flows in especially if it trades above 3171
Make sure to stick with the SL for 1d close below the red line
All the best insha Allah!
tfuel long for hold(hodl)#tfuel has a huge positive divergence in weekly timeframe it's also in big support zone it can be the lowest price for last time
#tfuel_usdt #crypto_currency

TFUEL has a very good investment Opportunity Hi Everyone;
today we have one of the best risk to reward Investment opportunity
it is more than 800 times the risk and the chart is look very promising.
I expect breaking the previous bear market key point will clear the way to the final target

Theta fuel (TFUEL) formed bullish Cypher for upto 15.50% pumpHi dear friends, hope you are well and welcome to the new trade setup of Theta fuel (TFUEL) with US Dollar pair.
Previously we caught almost 29% pump of TFUEL as below
On a daily time frame, TFUEL has formed a bullish Gartley for the next price reversal.
Note: Above idea is for educational purpose only. It is advised to diversify and strictly follow the stop loss, and don't get stuck with trade.

Tfuel Looking Ready for 300%+ Bullish Move Seems Like Looks Solid For Midterm falling Wedge Breakout Has Already Confirmed expecting 300%+ Bullish Wave Midterm

Analysis of this currency TFUEL USDT 1DFor long-term purchase and holding, this currency has growth potential
