$MGC (Gold) Update - June 11, 2025
Lets make some money!
- Wave B target was hit but it was due to news, so we are watching carefully for price action and levels.
- Confirmation for Wave C will be break of trendline and 3337 level.
- Levels to watch: 3366.6, 3345.5, 3387.6 and 3323.2.
TGM1! trade ideas


Gold Futures (GC) – May 28, 2025
Gold is currently trading within a clean range, and I’m keeping it simple:
🔴 I will only sell in the red supply zone, but only after seeing confirmed seller reaction and order flow backing the move.
🟢 I will only buy in the green demand zone, once buyers clearly show strength and the flow supports it.
📉 My target for any trade is always the opposite zone — if I sell in the red, I’ll target the green. If I buy in the green, I’m aiming for the red.
All of this holds until aggressive order flow tells me new participants are stepping in and shifting the narrative.
No trades in the middle. Discipline and confirmation first.
#GoldFutures #GCAnalysis #SmartMoney #OrderFlow #SupplyAndDemand #FuturesTrading #PriceAction #TradingDiscipline #TechnicalAnalysis

XAUUSD Bearish Rejection Setup Unfolding – June 11, 2025XAUUSD Bearish Rejection Setup Unfolding – June 11, 2025 🧠🔍
📊 Technical Breakdown:
🔴 Resistance Rejection Zone (Supply Area)
Price recently tested the $3,440 - $3,460 resistance zone, marked with red arrows. This zone previously acted as a strong supply area, leading to aggressive sell-offs.
📉 Bearish Rejection Candle
A rejection occurred near the same supply zone again, hinting at a potential double top or failure to break structure. Sellers seem to defend this area aggressively.
📍 Current Price: $3,338.6
Price is hovering below mid-range resistance at $3,396.5, indicating weakness after a failed breakout.
📉 Bearish Plan in Motion:
🔁 Scenario Highlighted:
Price might retest the $3,396.5 level (purple line) before resuming the downward move (illustrated by the blue and black arrows).
A breakdown below the $3,290.3 support zone will likely trigger further downside.
🎯 Target Levels:
1st Target: $3,290.3 – Key structural support. A close below this level will confirm the bearish momentum.
2nd Target: $3,207.0 – Final support area aligned with previous accumulation zone.
🛑 Invalidation Point:
A sustained breakout above $3,460 would invalidate the bearish bias and suggest continuation to the upside.
✅ Summary:
Bias: Bearish 📉
Strategy: Sell on pullback to $3,396.5 with stops above $3,460.
Targets: 🎯 $3,290.3 ➡️ $3,207.0
Watch for a strong bearish confirmation candle below $3,290.3 to load in shorts.
🔔 Stay alert for volume spikes and lower time-frame breakdowns to fine-tune entries! 💼📊

Shorting GoldWell, iam taking this trade for sure.
Iam shorting Gold again because of the following reasons.
The reason behind this trade is the IFVG that is nested withing the now resistance level (marked in black)
Secondly, there is a broken trendline that i dont think it will be reclaimed anytime soon (marked in yellow).
There are many others small details that should point toward a bearish scenario.
but on a scale from 1 to 10, how confident in my analysis iam, is 7.5.
Boost the idea if you like it : D


GOLD- WATCHING IT CLOSELY.🔍 Chart Analysis
🏗️ Structure & Patterns
A perfect Cup & Handle formation is visible.
Price has broken out above the neckline (~₹98,000) but is currently in a pullback phase, forming the handle.
A falling wedge breakout is also seen prior to the breakout — a bullish continuation pattern.
📐 Fibonacci Retracement
0.382 level at ₹96,132
0.5 level at ₹95,132
These retracement levels align well with the handle zone and offer potential re-entry/buy levels.
🛡️ Key Support Levels
Level Description
₹98,000 Former resistance, now short-term support
₹96,132 38.2% Fib retracement
₹95,132 50% Fib retracement (also demand zone)
₹94,200 Major support
🔵 Note: Breakdown below ₹95,132 is bearish confirmation.
📊 RSI Analysis
RSI = 54.59, cooling off from overbought levels.
RSI has crossed below the RSI-based moving average (63.43), indicating temporary loss of momentum.
📈 Projected Path
The handle curve suggests a possible rebound after this pullback, targeting previous high ~₹99,358, and possibly ₹101,317 (height of cup projected upward).
✅ Summary
Category Observation
Pattern Bullish Cup & Handle with falling wedge breakout
Trend Bullish above ₹95,132; Weak only if closes below
Key Levels Support: ₹98,000 / ₹96,132 / ₹95,132 / ₹94,200
Resistance: ₹99,358 / ₹101,317
RSI Cooling down; not overbought; healthy retracement
Bias Bullish with pullback in progress; re-entry near ₹96k–95.1k zone
🧠 Final Thoughts
Pullbacks are healthy in bullish setups like this — watch for reversal signs near ₹96,132 or ₹95,132.
A daily close above ₹99,358 can trigger Cup & Handle target breakout toward ₹101,300+.
Maintain bullish bias unless ₹94,200 is breached.


Gold exact rejection from supply zone Gold took exact rejection from supply zone . We took sell trade below supply zone sl was above the zone and target is demand zone .
Our strategy is to sell from supply or buy from demand . Today sell got active first and price moved in our direction. Waiting for target demand zone


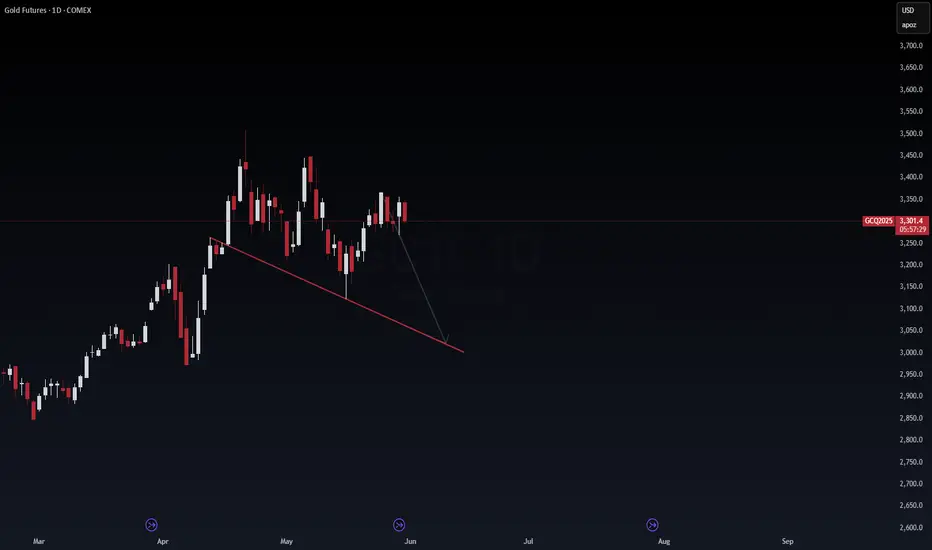
GOLD GC /GC GC1! XAU/USD: Arbitrage Oppertunity. Gold Futures (GC1!) – Breakdown Ahead? Arbitrage Opportunity Emerging
🔍 Daily Chart Analysis by Wavervanir International LLC
⚠️ Key Technical Observations:
Descending Triangle Breakdown Risk: Gold has rejected resistance near $3,350 multiple times. The lower highs and horizontal support suggest a descending triangle structure.
Projected Breakdown Zone: If $3,280 support fails, we could see a swift move toward $3,100 or even lower, near the $2,950 zone.
Lower Trendline Magnet: Price appears to be gravitating toward a key trendline formed from April’s breakout, which aligns with the $2,950–$3,000 confluence zone.
💱 Arbitrage Opportunity: GC1! vs XAU/USD vs /GC
There is growing dislocation among:
GC1! (Gold Futures – COMEX)
/GC (Front-Month Gold Futures)
XAU/USD (Spot Gold)
Watch for inefficiencies due to:
🔁 Hedging lag across timeframes (spot vs futures)
💰 Rate differential effects (carry cost, interest rates)
🌍 Currency mismatch in spot vs USD-settled futures
If the spot-futures basis widens unjustifiably, a short GC1! / long XAU/USD setup could exploit mean reversion. Advanced traders might also consider calendar spreads (/GC Jun vs Aug) if volatility compresses.
📊 Probabilistic Outlook:
Scenario Probability Commentary
Breakdown Toward $2,950 55% Technical structure favors bears unless macro shifts occur.
Bounce and Range Around $3,300 30% Compression before Fed/JOLTS/NFP may cause chop.
Breakout Above $3,375 15% Requires macro catalyst—like Fed rate cut, geopolitical shock, or weak USD
🧠 Macro Factors to Monitor:
FOMC & FedSpeak (June) – If rate cuts are delayed, gold could lose momentum.
Real Yields (10Y TIPS) – Rising real yields = bearish gold.
Geopolitical Tensions – Any flare-ups (Middle East, Taiwan) may flip sentiment fast.
China/BRICS Demand – Gold import/export data could signal accumulation or slowdown.
💡 We’re monitoring these inefficiencies for tactical plays under the Wavervanir macro-arbitrage lens. Stay updated for real-time trade ideas and DSS-based execution.
#Gold #GC1 #XAUUSD #FuturesTrading #MacroArbitrage #CommodityTrading #Wavervanir #RiskManagement
Gold (GC) Trade Plan – Watching Key Zones for Reaction Currently watching Gold Futures (GC) as price moves within a defined range.
✅ Buy Zone (Green): Waiting for price to reach this demand area and show a bullish reaction confirmed by order flow before entering long.
❌ Sell Zone (Red): If price pushes into this supply area, I’ll consider a short setup only if there’s clear bearish confirmation on order flow (e.g., trapped buyers, absorption, or momentum shift).
⚠️ No reaction = no trade. I’m simply reacting to what the market gives me, not predicting.
Let the flow guide the entries. 🧠📊


Gold: Primarily HigherIn our primary scenario, we expect gold to set a new all-time high as part of the ongoing beige wave I. To achieve this, the price should soon generate more upward momentum during the subordinate light green wave 5 and surpass the current all-time high from April 22. Once the wave I cycle has concluded at higher levels, we anticipate the start of a new bearish phase. However, there remains a 40% chance that the precious metal has already completed the beige wave alt.I and is now entering a fresh downward cycle. Under this alternative scenario, the price would break directly below the supports at $3,123 and $2,970.
📈 Over 190 precise analyses, clear entry points, and defined Target Zones - that's what we do.

Gold Future MCXThe Gold Future Price is Stuck in A Triangle Trend Lines.
There is Good Action Seen from Both Buyers and Sellers. Lets se who wins it.
If the price breaks DOWN the Support Trend Line with Good Volume "THE PRICE CAN TRAVEL DOWN TILL 90000 Levels."
If the Price Breks UP the Resistance Trend Line with Good Volume " THE PRICE CAN TRAVEL UP TILL 95500 Levels."
NOTE: (In My View)
Price Going Down till 90000 is More Likely.....

GOLD SILVER Ratio Charts MCX INDIA MCX:GOLD1! *100/MCX:SILVER1!
This is a Ratio charts ... Which Shows Outperformance of One asset over other ... You have to Buy one and Sell One to full reflect what it is showing ... so Things may not workout It you trade one only ...
It Can be Clearly Seen Gold is outperforming Silver ....
What it is indicating is the main point ...Silver being a industrial metal more demand for Gold could be safe haven buying which means less demand for silver implying less industrial activity bad for economy ... or impending recession in US ... Recently Yield Curves 2s10s inverted in US so ... that would also signal a impending recession which lags by at least by 12 months ...
When reversal comes Chart may change Currently or can be seen on lower time frame it is what it is ....
Similar Things on International/COMEX Charts or Dollar based charts can be seen

Gold Still bearish for the momentLooking for gold to fill in a Bullish gap before I consider longs. price is pretty bearish this week and im thinking it due to the contract roll and month end close. Looking for price to find some area of support before considering going Long. As always we wait for the Killzones.


Gold at a Psychological Level Gold has now risen to 100 times its previously fixed price of $35 per ounce.
Is this a psychological milestone signaling a correction ahead, or is there still more upside potential?
Under the Gold Reserve Act of 1934, gold was officially priced at $35, a rate maintained until 1971, when President Nixon suspended the dollar’s convertibility into gold, effectively ending the gold standard. This historic move, known as the “Nixon Shock,” allowed gold to trade freely in the market. By December the same year, the market price had already climbed to around $43–44 per ounce.
So why has gold risen from $35 to $3,500?
Gold is widely recognized as a hedge against inflation—but in reality, it has proven to be more than that.
Let’s consider this:
If inflation had compounded at the target rate of 2% per year since 1971, gold should be priced at $102 today.
But at $3,500, the also implied that the compounded annual growth rate is around 8.9%.
So, what explains this outperformance?
One key driver is the expansion of the money supply, especially through debt, and more critically, debt financed by money printing.
Periods of high inflation are can be preceded by an unjustified increase in the money supply, not backed by corresponding income or production output.
In 2018, we saw the beginning of Trump’s Tariff 1.0. Since the anticipation of Trump’s Tariff 2.0, I’ve incorporated a framework I call the QTD Matrix—which stands for Quantitative Easing, Tariffs, and Debt—to track the trajectory of gold prices.
As long as we continue to see:
• Central banks deploying Quantitative Easing during crises,
• Ongoing or escalating Tariff wars, and
• Persistent growth in national Debt,
It is reasonable to expect gold to remain firm and potentially break into new highs.
Historical Observations:
• Let’s start with Gold vs QE. Each major wave of QE has triggered a significant rally in gold—from Japan’s QE in 2001, to US QE1, QE2, and QE3 following the 2008 crisis, and the massive Covid-era QE in 2020.
• Next Gold vs Tariffs. When Trump’s Tariff 1.0 was announced in August 2018, gold pivoted on that very day and began trending higher.
In October 2022, Biden’s export controls on advanced chips acted as a tariff-equivalent event, once again prompting gold to rise.
After Trump's re-election in November last year, markets began pricing in Tariff 2.0, and gold responded by trending upward once more.
• Finally Gold vs Debt. Gold has also moved in close tandem with the rising US debt over the years.
As of now, I believe that QE (Q), Tariffs (T), and Debt (D) will remain in play.
Hence, it's reasonable to expect:
• The cost of living to remain elevated,
• Inflationary pressures to persist, and
• Gold prices to continue their long-term uptrend.
That said, I’m also noticing technical and psychological resistance in the mid-term after it reached $3,500.
This is a quarterly chart, once I have identified its primary uptrend line, I would like to mirror it to its significant peak (going back way back the 1980s, a period of high inflation), which appears to intersect around the psychological level of $3,500.
With the trade war currently on pause, gold may temporarily take a breather. But as long as QTD remains intact, it may just be a matter of time before gold tests its recent resistance—and, if broken, continues its upward trajectory.
We should also ask:
Is there any possibility that the Q, T, or D could shift in the opposite direction?
If so, that could be a positive sign for equity markets.
Micro Gold Futures & Options
Ticker: MGC
Minimum fluctuation:
0.10 per troy ounce = $1.00
Disclaimer:
• What presented here is not a recommendation, please consult your licensed broker.
• Our mission is to create lateral thinking skills for every investor and trader, knowing when to take a calculated risk with market uncertainty and a bolder risk when opportunity arises.
CME Real-time Market Data help identify trading set-ups in real-time and express my market views. If you have futures in your trading portfolio, you can check out on CME Group data plans available that suit your trading needs www.tradingview.com
Trading the Micro: www.cmegroup.com
www.cmegroup.com
