Altcoins Index TOTAL2 and TOTAL3 are on the verge of a major breThe major resistance level that has persisted for almost 4 years since the 2021 ATH in two pairs is also on the verge of breaking the supply zone.
Key data points
Previous close
—
Open
—
Day's range
—
About Crypto Total Market Cap Excluding BTC, $
Bitcoin is quite a heavy-weight fighter which makes it difficult at times to correctly define how the crypto market is doing — it just outshines other coins, and you can't see clearly. Since Bitcoin presents such a huge piece of the crypto pie, excluding it from counting sounds reasonable and lets you see a more clear picture of where the crypto market is moving at the moment. That is what you can see on the chart we've prepared — calculated by TradingView, it displays global crypto market cap without Bitcoin's share.

TOTAL2 Elliot Wave BREAKOUT ALERT - Altseason Incoming ? TOTAL2 Elliott Wave BREAKOUT ALERT: Altseason Incoming? 🚀📈
Alright, folks—checking in on the TOTAL2 chart (total crypto market cap excluding Bitcoin) as of Sep 27, 2025. We're sitting at about 1.155T USD after a 6.93% dip.
I've been diving into Elliott Wave Theory here, and it's painting a pretty

Altcoin Market Cap (TOTAL2) Breaking the 2021 Bull Market PeakThe TOTAL2 chart, representing the total crypto market cap excluding Bitcoin, has officially broken above its 2021 bull market highs for the first time in nearly 4 years.
This breakout marks a major structural shift from consolidation into potential expansion.
Key levels & structure:
Breakout zon

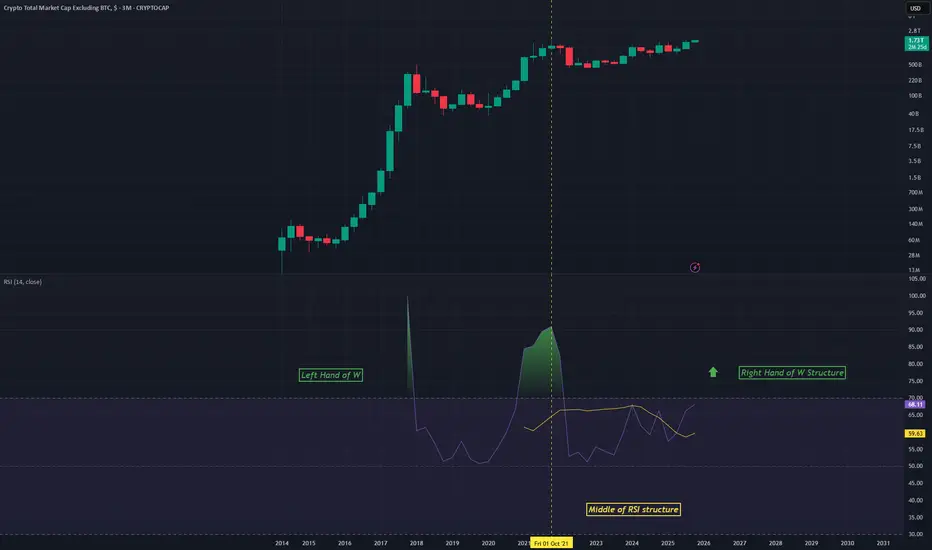
TOTAL2 - RSI StructureAn idea using the RSI on the Monthly chart for TOTAL2
A sort of W pattern is forming on the RSI
We are about to experience the right hand of this W structure which is a bullish phase
Long big altcoins
Altcoins VS. SilverSimilar technical structure in two different markets
Price and RSI are breaking above the major resistance level together.
Altcoin market cap (Total2) and silver chart, with the same supply zone and RSI breakout pattern, show a structural bullish signal.

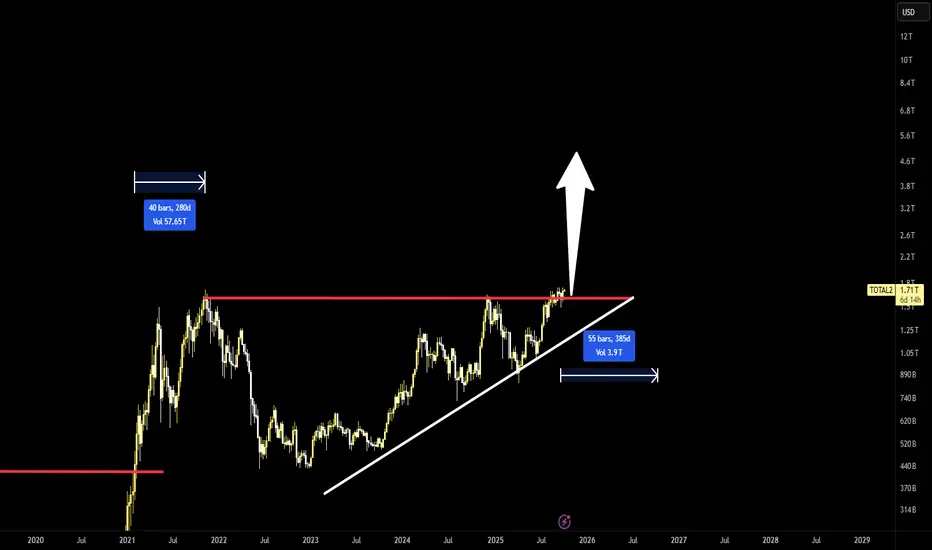
Crypto supercycle - the journey to 5T alt cap begins- it has been a long wait and definitely a different market cycle compared to the rest but it seems the patience is finally about to pay off
- TOTAL2 in a clear, multi-year ascending triangle that has now been resolved to the upside
- looking at +10$ XRP, +1$ DOGE, + 12k ETH, + 600$ Litecoin and + 4
Layer 1 Liquidity — The Silent Game-Changer?🧩 There’s a pattern brewing beneath the noise...
While most eyes are glued to Bitcoin and Ethereum liquidity traps, Layer 1 liquidity (bottom left chart) seems to be quietly building pressure — right at a structural point where previous bearish algorithms have always regained control.
But this t

Alt Season? Or Bull Trap...Either we're about to go full on parabolic or it's a huge bull trap - can't be anything else at this point - Looks to be in the early stages of a larger wave 3.

The Unexpected Top? Is this the final leg for alts?Bitcoin is now institutionalized. It’s manipulated to move like S&P stock. Doesn’t need to mirror the price action but in gradual surges of around 90-110% from the Q4 Lows.
Everyone is waiting for euphoria but with retail getting debased to 0 they choose food over coins.
The biggest hoax was gett

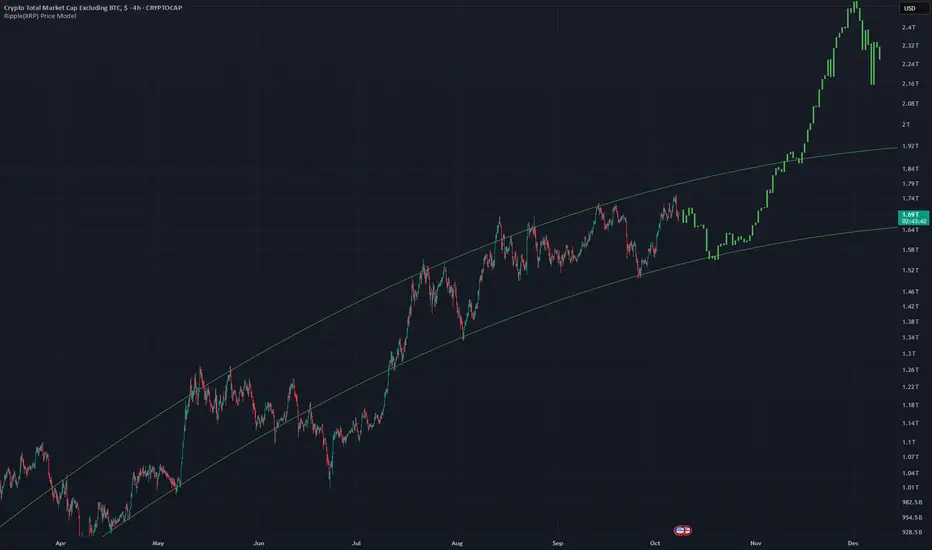
TOTAL2 - Break Out of Curved Channel Price has been moving up along this channel for awhile now and it is now time to break out of it.
This is the 4Hr chart for the altcoin market. A similar pattern occurred on same chart months ago and the bars pattern (in green) is the result of the curved channel breakout.
Lets see what happens.
See all ideas
Summarizing what the indicators are suggesting.
Oscillators
Neutral
SellBuy
Strong sellStrong buy
Strong sellSellNeutralBuyStrong buy
Oscillators
Neutral
SellBuy
Strong sellStrong buy
Strong sellSellNeutralBuyStrong buy
Summary
Neutral
SellBuy
Strong sellStrong buy
Strong sellSellNeutralBuyStrong buy
Summary
Neutral
SellBuy
Strong sellStrong buy
Strong sellSellNeutralBuyStrong buy
Summary
Neutral
SellBuy
Strong sellStrong buy
Strong sellSellNeutralBuyStrong buy
Moving Averages
Neutral
SellBuy
Strong sellStrong buy
Strong sellSellNeutralBuyStrong buy
Moving Averages
Neutral
SellBuy
Strong sellStrong buy
Strong sellSellNeutralBuyStrong buy
Displays a symbol's price movements over previous years to identify recurring trends.