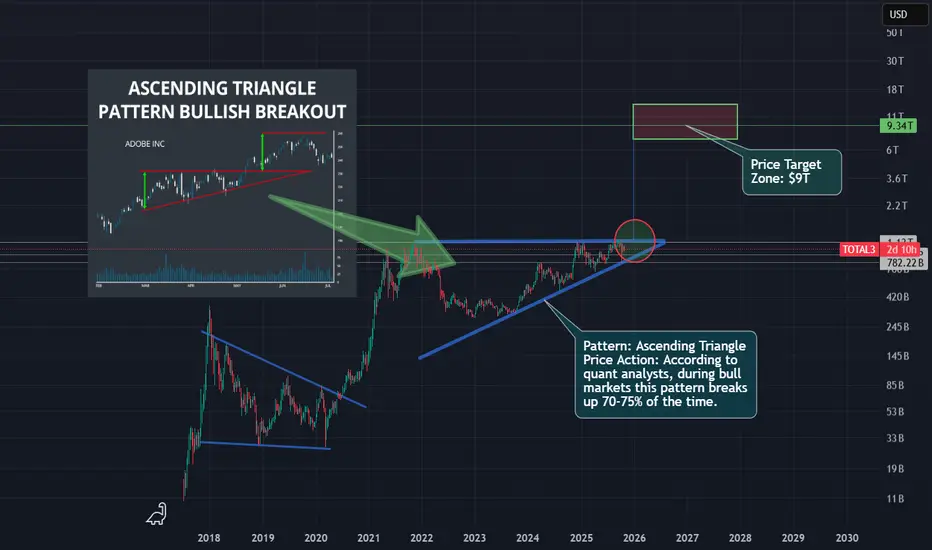
Zoom out to see the bigger TOTAL3 Crypto picture!This is just my opinion, but judging by the Total 3 crypto market cap today, we can see an a large ascending triangle has been forming on the weekly time frame and it looks to break soon. This pattern (in a bull market) may break up 70-75% of the time. I believe that puts a measured move to approx.
Key data points
Previous close
—
Open
—
Day's range
—
About Crypto Total Market Cap Excluding BTC and ETH, $
Bitcoin and Ethereum are such major players and so popular among investors that when you enter the market, they draw all the attention to themselves leaving other coins in their shade. It's not that they do not deserve this attention, but without their colossal figures, investors could take a healthier look at the crypto market to define its overall state and direction. Following this logic, we've calculated total crypto market capitalization excluding BTC and ETH market caps and displayed how the final number changed over time on the chart. Hope it proves useful in your analysis of crypto markets.
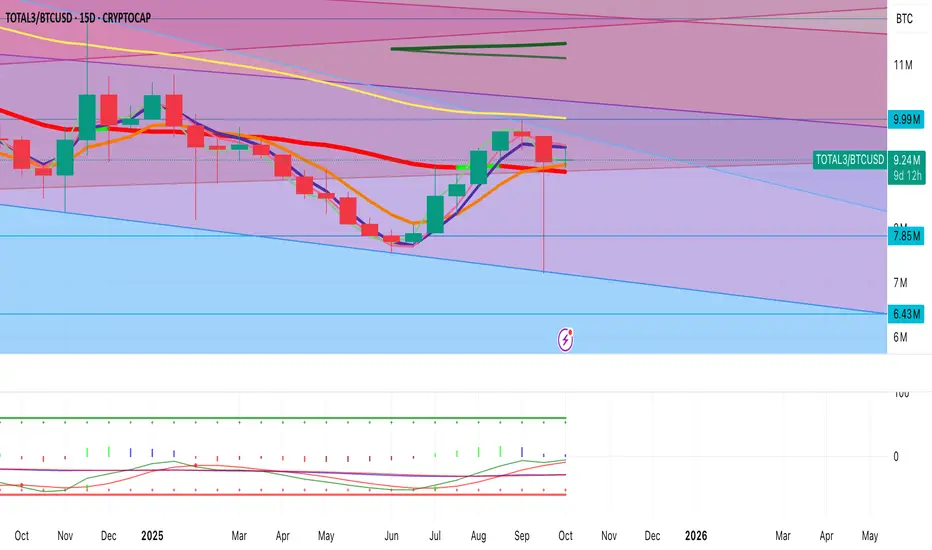
Total3 \ Altcoins On the Total3 chart, the price is trapped within the 3.8-year-old major resistance and uptrend range, which hasn't been surpassed even during the recent rally.
price is holding strongly above the 4.2-year uptrend support and the 21EMA.
Even the recent downtrend wave failed to break this structur

TOTAL 3 Analysis (1D)First of all, I'd suggest you to examine previous Total 2 analysis :
The idea is simple just like the previous analysis. There is a mitigated demand zone below the current price and it's not going to be helpfull if price wants to seek support for a new upwards momentum.
If the Total 3 market to

Altcoin / XOP (Oil)Altcoins are soon to be overvauled compared to oil to an extreme degree. Sell altcoins near top to rotate.

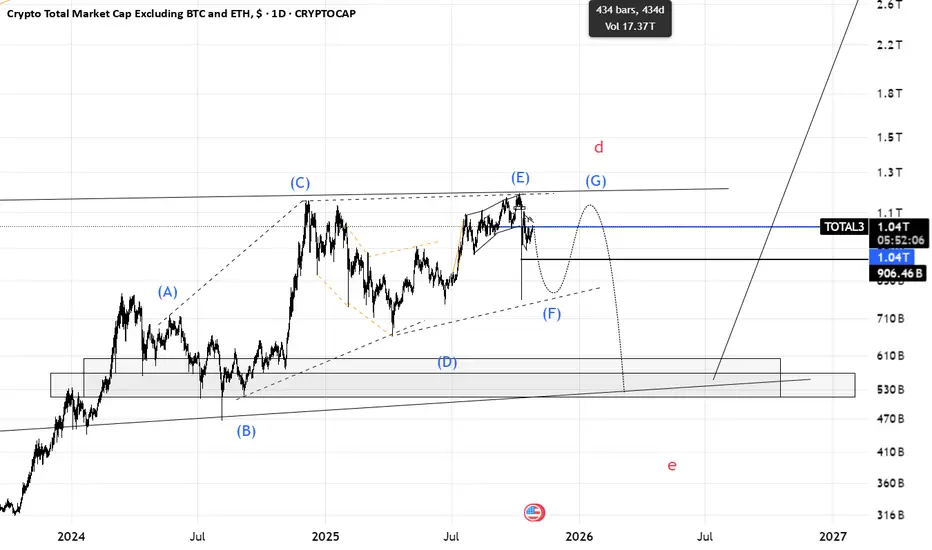
Total3(based on NEo wave)I think this branch is diametric. in last chart I thought its a triangle but its a diametric.
we should for wave F to finish and wave G to start then there is a heavy bearish wave for total3 and altcoins.
TOTAL3TOTAL3 is showing a more and more bearish trend. Altcoin holders should be careful. If the price breaks 965.46B, the downtrend starts. But if the price breaks 1.07B, the uptrend will continue.
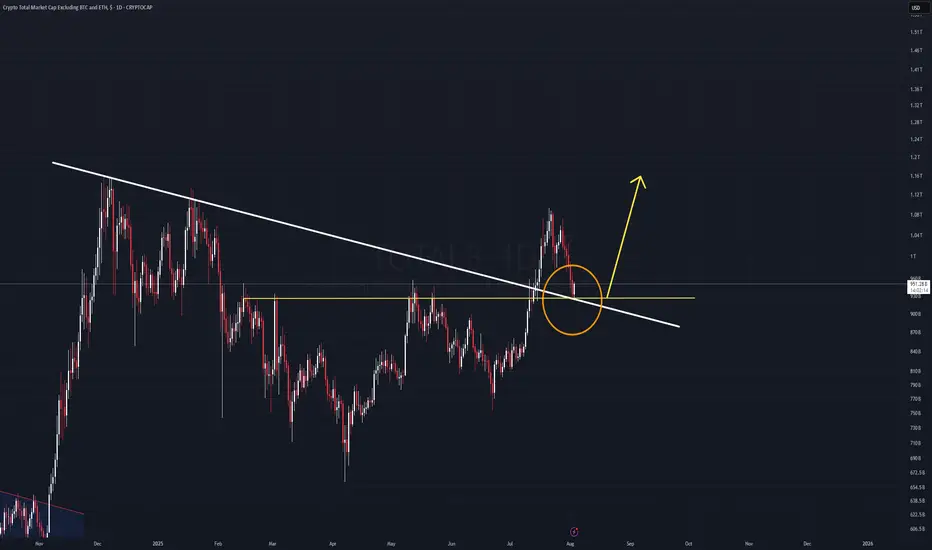
TOTAL 3 Analysis (1D)The TOTAL3 chart is currently retesting a key diagonal trendline that was broken previously. This is a classic bullish retest scenario.
If the current daily candle closes green, and is followed by a strong impulsive candle without invalidation, it could signal the start of a new leg upward, right
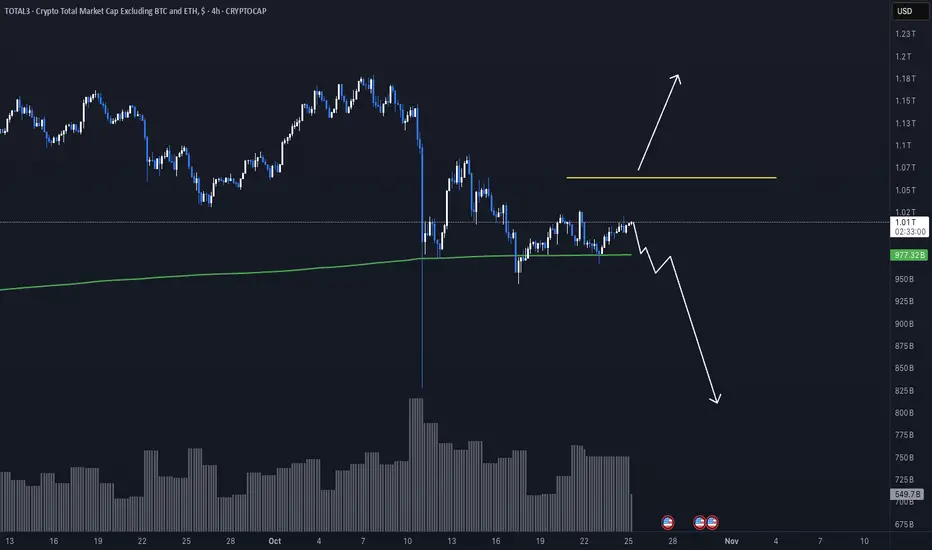
(ALTS MARKET CAP) UPDATE Total 3 or in simple terms ( ALTS MARKET CAP), looks a bit bearish.
We will see a clear move toward the lower trendline support, coinciding with the 0.5 Fibonacci retracement level at approximately $930 billion.
A robust bounce will follow from this level.
If you're an active trader, stay vigilan

MASSIVE MOVE FOR ALTCOINS INCOMING GOD CANDLE Classic doji printed only a matter of time before we see a huge leg up on alts
Altcoin Market Cap Sep/Oct 2021 Compared to NowA speculative look at the Altcoin Market Cap, minus Bitcoin & Ethereum, Sep/Oct 2021 compared to now. Past performance doesn't guarantee future results but fingers crossed.

See all ideas
Summarizing what the indicators are suggesting.
Oscillators
Neutral
SellBuy
Strong sellStrong buy
Strong sellSellNeutralBuyStrong buy
Oscillators
Neutral
SellBuy
Strong sellStrong buy
Strong sellSellNeutralBuyStrong buy
Summary
Neutral
SellBuy
Strong sellStrong buy
Strong sellSellNeutralBuyStrong buy
Summary
Neutral
SellBuy
Strong sellStrong buy
Strong sellSellNeutralBuyStrong buy
Summary
Neutral
SellBuy
Strong sellStrong buy
Strong sellSellNeutralBuyStrong buy
Moving Averages
Neutral
SellBuy
Strong sellStrong buy
Strong sellSellNeutralBuyStrong buy
Moving Averages
Neutral
SellBuy
Strong sellStrong buy
Strong sellSellNeutralBuyStrong buy
Displays a symbol's price movements over previous years to identify recurring trends.