Dow Jones Potential UpsidesHey Traders, in today's trading session we are monitoring US30 for a buying opportunity around 42,100 zone, US30 is trading in an uptrend and currently is in a correction phase in which it is approaching the trend at 42,100 support and resistance area.
Trade safe, Joe.
Wall Street 30 - Rolling Future
42,630.0USDR
−265.5−0.62%
As of today at 11:44 GMT
USD
No trades
Key data points
No news here
Looks like there's nothing to report right now

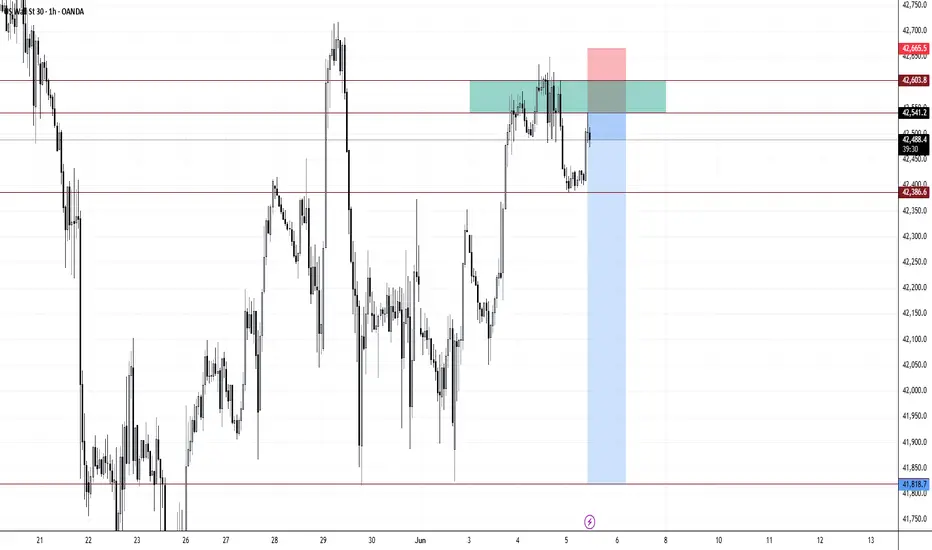
US30 Technical Analysis – 8th June 2025c US30 Technical Analysis – 8th June 2025
🔍 Chart Overview:
The chart shows a classic range-bound structure with clearly defined support and resistance zones.
📍 Key Zones:
🔼 Resistance Zone: ~$42,900 – $43,000
Marked by multiple rejections (🔴 red arrows).
Price has failed to close above this ar

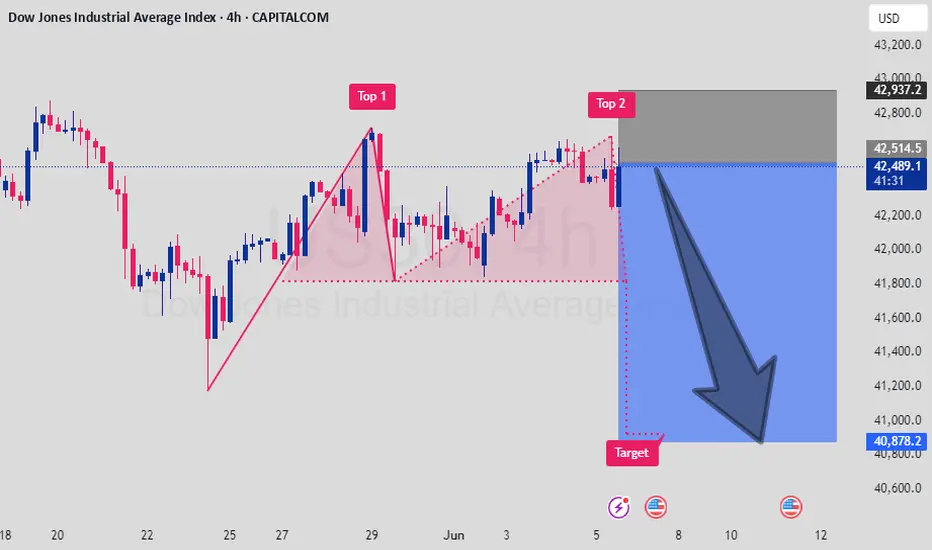
Double Top Pattern Signals Bearish Reversal (Short Trade ActiveThe Dow Jones Industrial Average Index (DJI) on the 4H chart has formed a Double Top pattern, indicating potential trend exhaustion and bearish reversal. The price was rejected near 42,900 twice and has now broken below the neckline, triggering a short trade setup.
🔹 Pattern: Double Top
🔹 Resista

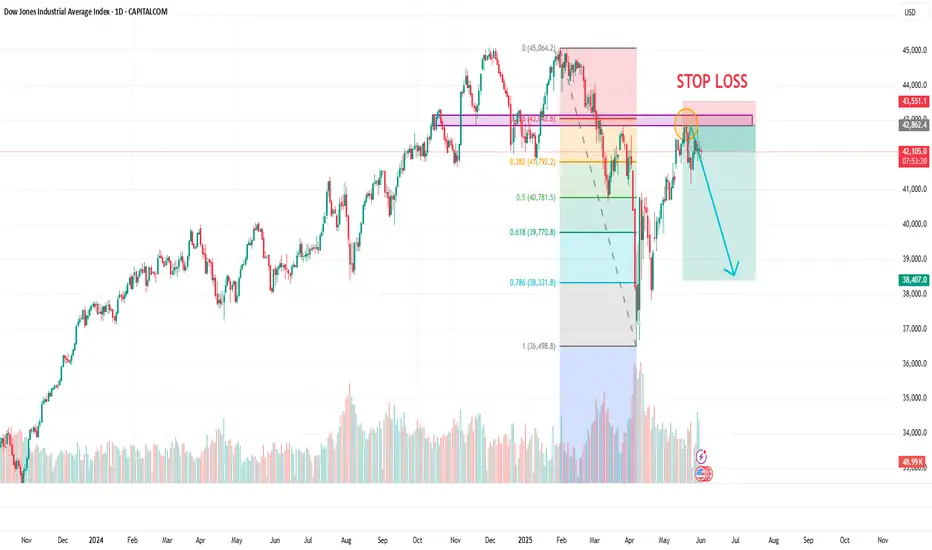
DOW JONES: Turning sideways for summer. Massive rise afterwards.Dow Jones is bullish on its 1D technical outlook (RSI = 58.389, MACD = 425.040, ADX = 23.083) but 1W is neutral, a natural outcome of the ranged trading within the 1D MA200 and 1D MA50in the last 3 weeks. It is possible to see the index staying sideways until the end of August and then attempt to co


US30 SELLING ON DIPS !!HELLO TRADERS
AS I CAN SEE US30 is fail to break resistence zone after making a ATH its time to retrace as we can see bad econmy of US and GDP investors will pull money from stocks and invest in Safe haven so our Risk reward is great for us it is just a trade idea share ur thoughts stay tuned for m
See all ideas
Displays a symbol's price movements over previous years to identify recurring trends.
Frequently Asked Questions
Wall Street 30 - Rolling Future reached its highest quote on Jan 31, 2025 — 45,226.0 USD. See more data on the Wall Street 30 - Rolling Future chart.
The lowest ever quote of Wall Street 30 - Rolling Future is 28,639.0 USD. It was reached on Oct 3, 2022. See more data on the Wall Street 30 - Rolling Future chart.
Wall Street 30 - Rolling Future is just a number that lets you track performance of the instruments comprising the index, so you can't invest in it directly. But you can buy Wall Street 30 - Rolling Future futures or funds or invest in its components.