NATGAS - Head and Shoulder pattern? - SHORTI see a potential H&S pattern short in formation
It can be completed with break of neck line ..
Aggressive trade can be do with an entry and stop loss above the actual max.
Key data points
No news here
Looks like there's nothing to report right now


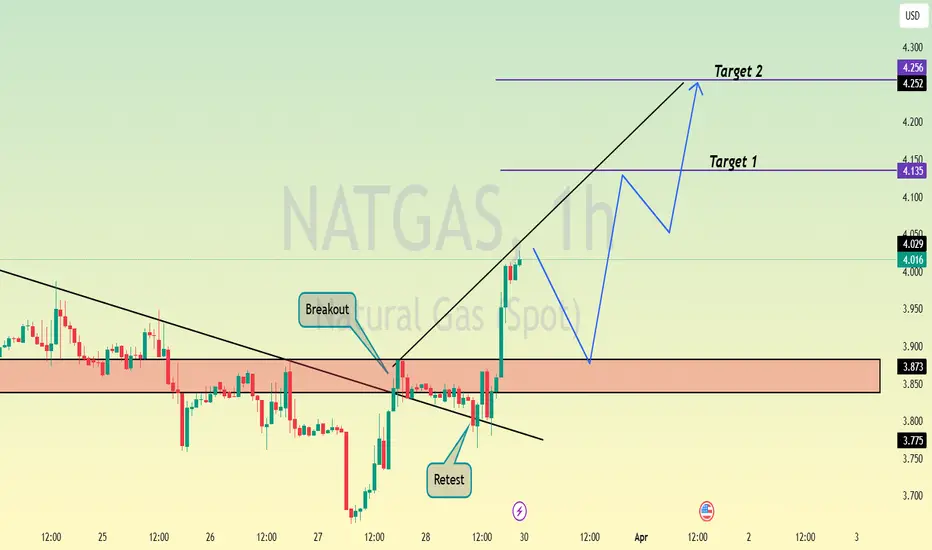
Natural Gas is in the Buying DirectionHello Traders
In This Chart NATGAS HOURLY Forex Forecast By FOREX PLANET
today NATGAS analysis 👆
🟢This Chart includes_ (NATGAS market update)
🟢What is The Next Opportunity on NATGAS Market
🟢how to Enter to the Valid Entry With Assurance Profit
This CHART is For Trader's that Want to Improve Their Te


Natural Gas: In a Clear Bearish Movement After CorrectionNatural Gas: In a Clear Bearish Movement After Correction
From our previous analysis, NG created a bearish correction that lasted for about 1 week and took place between 4 and 4.3.
After the pattern ended, the price fell by almost 13% in just 6 days.
News Today: Oil prices edged up on concern

Trend Reversal With Low Demand Natural Gas Outlook: Bearish signals dominate NATGAS with a Head & Shoulders pattern, Shooting Star, and Bearish Engulfing on the chart.
Technical Indicators: RSI is declining, and MACD shows bearish momentum, supporting further downside.
Weather Impact: The UK forecast for the next two weeks show

See all ideas
Displays a symbol's price movements over previous years to identify recurring trends.