US30 Technical Analysis Based on the Dow Jones Industrial Average (US30) chart as of June 8, 2025, here is a brief technical analysis to assess a buy or sell position:
Key Observations:
Current Price: 42,781.3 (closing price), down -0.23% for the day.
Technical Levels:
Nearby Resistance: 42,888.0 (daily high) and 43,324.1 (intermediate level).
Immediate Support: 42,532.9 (lower level) and 42,150.1 (key support).
Psychological Levels: 43,000 (resistance) and 42,000 (support).
Overall Trend:
The price is trading in a range between 42,150.1 and 43,324.1, with slight recent downward pressure.
Moving averages or other indicators are not visible on this chart, but the volume (63.24K) appears moderate.
Possible Scenarios:
Buy (Long):
If the price bounces from support at 42,532.9 or 42,150.1 with increasing volume, a rebound toward 43,000 is possible.
A breakout above 42,888.0 (daily high) could confirm bullish momentum.
Sell (Short):
If the price breaks below 42,150.1, it could open the door to 41,000.0 (major support).
The weak daily performance (-0.23%) and failure to sustain gains might indicate temporary weakness.
Recommendation:
Wait for Confirmation:
For a buy, watch for a bounce from the mentioned support levels with rising volume.
For a sell, wait for a clear breakdown below 42,150.1.
Risk Management: Place a stop-loss below 42,000 for a buy or above 43,000 for a sell.
Note: Without additional technical indicators (RSI, MACD, etc.), this analysis is based on visible price levels. Use other tools to refine your strategy.
📌 Prioritize trades aligned with the overall trend (currently neutral to slightly bearish on this timeframe).
Let me know if you'd like any further refinements!
Dow Jones Industrial Average Index
42,576.53USDR
−329.65−0.77%
As of today at 15:52 GMT
USD
No trades
US30 trade ideas
US30: The Market Is Looking Down! Short!
My dear friends,
Today we will analyse US30 together☺️
The market is at an inflection zone and price has now reached an area around 42,877.4 where previous reversals or breakouts have occurred.And a price reaction that we are seeing on multiple timeframes here could signal the next move down so we can enter on confirmation, and target the next key level of 42,798.2..Stop-loss is recommended beyond the inflection zone.
❤️Sending you lots of Love and Hugs❤️

US30 Analysis: Liquidity Dip or Deeper Correction?📉 US30 (Dow Jones) Trade Idea 📉
Currently analysing US30 – the Dow Jones Index 🏛️, and there are some key developments worth noting…
On the 4-hour timeframe, we’re observing a clear shift in market structure, with price breaking through previous lows ⚠️. This raises two possibilities:
🔹 It could be a liquidity grab before a rally 🚀
🔹 Or, it may be the beginning of a deeper end-of-week sell-off targeting levels below 🔻
At this stage, I’m watching for a potential counter-trend short position — but only if the conditions outlined in the video are met with precision 🎯.
🧠 As always, it’s about waiting for confirmation, not jumping in early. Disciplined execution is key. 🧩💼
⚠️ Disclaimer: This is not financial advice. The information provided is for educational purposes only. Always do your own analysis and manage risk accordingly.

US30 SELLING ON DIPS !!HELLO TRADERS
AS I CAN SEE US30 is fail to break resistence zone after making a ATH its time to retrace as we can see bad econmy of US and GDP investors will pull money from stocks and invest in Safe haven so our Risk reward is great for us it is just a trade idea share ur thoughts stay tuned for more updates

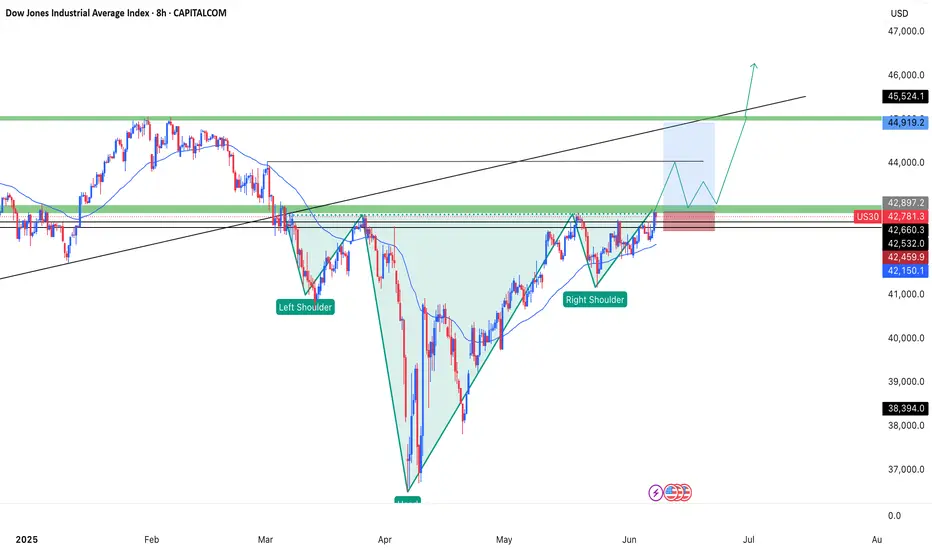
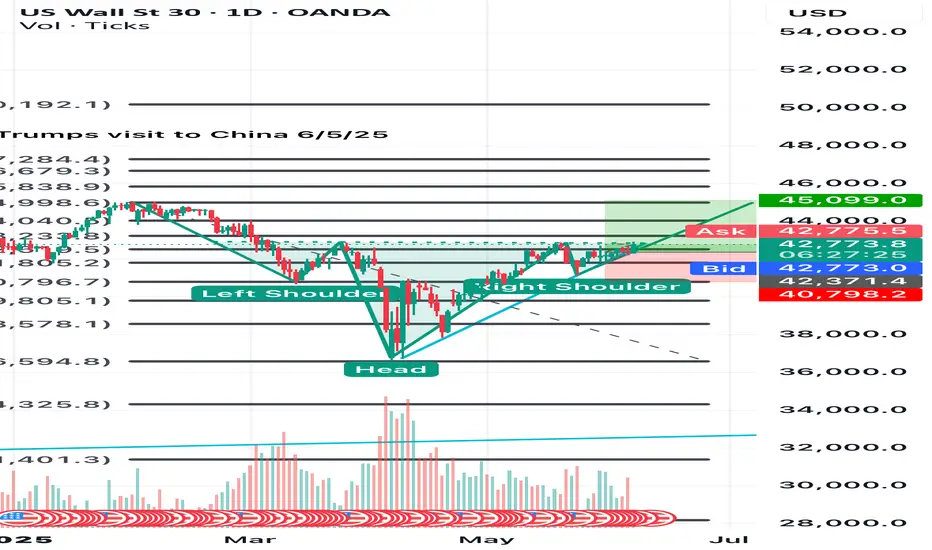
Potential H/S Forming US30 (Daily)Trump/Musk beef(fake???). Trump/Xi meeting went well yesterday. NFP/Hourly Earnings @1230.
Nice reject at resistance on US30. Tsla running up pre-market. Got a feeling today is going to be a day to remember. We’ll see if this inverted head and shoulders will withstand the hurdles and test of time.
#invertedheadandshoulders
#daytrading
#chartpatterntrading
#US30
#us30signals

US30 Breakout Alert: Is 43,100 the Next Stop?📈 US30 30M Chart Outlook – Breakout Potential Ahead
Technical Outlook — June 6, 2025
Current Market Condition:
US30 (Dow Jones Industrial Average) is currently consolidating on the 30-minute chart following a sharp rally, trading around 42,754.50 with a marginal dip of -0.01%. Price is hovering between a key intraday support zone at 42,737.31 and resistance at 42,900.00, creating a high-probability setup for a breakout in either direction.
Key Technical Highlights:
Price is trading above both the 50 EMA (blue line) and 200 MA (red line), with both lines converging — a typical precursor to an impulsive move.
A tight consolidation range has developed, with bulls and bears battling between 42,737.31 and 42,900.00.
The Stochastic Oscillator is hovering near the 40 level, suggesting neutral to slightly oversold conditions — an early sign that bulls might regain control.
A breakout above 42,900.00 could pave the way for a rally toward 43,100.00.
On the flip side, a breakdown below 42,737.31 may trigger a correction back to the 42,600.00 support zone.
Possible Scenarios:
🔼 Bullish Case:
A clean break and hold above 42,900.00, supported by rising momentum, could fuel a short-term rally toward the 43,100.00 resistance area. If bullish continuation persists, further upside expansion is possible.
🔽 Bearish Case:
Failure to break 42,900.00 followed by a bearish close below 42,737.31 may indicate rejection, opening the door for a retracement toward 42,600.00. Increased selling volume at that point could invite deeper pullbacks.
Important Note:
Be cautious of increased volatility from upcoming economic data or geopolitical catalysts. Watch closely how price behaves around 42,900.00 and 42,737.31 to catch the next directional move early.
If you found this analysis valuable, kindly consider boosting and following for more updates.
Disclaimer: This content is intended for educational purposes only and does not constitute financial advice.

US30 Update bullish📊 US30 Update 🚀
Great job team! ✅ Our first TP was hit 🎯 and we’ve now secured our second entry after a solid retracement back to our initial zone. This is a strong buy-back opportunity, and momentum is building up again! 🔥
We’re now expecting a push towards our second TP at 43,300. 📈 Stay sharp and remember:
🧠 Trade smart,
📉 Manage your risk,
💰 No oversized lot sizes — let the setup do the work.
Let’s keep winning! 💪
#US30 #CPI #TP1Hit #SecondEntry #ForexTraders #SmartTrading #TeamWork

Quick Look: Dow Jones - Don't Miss These Levels!US30 Intraday Setup
Technical Outlook — 9 June, 2025
Market Context:
The Dow Jones (DJI) is currently consolidating around 42,760 after a recent rally. Price action suggests a potential "bear flag" formation near the "Previous Day High," indicating a crucial decision point for the short-term trend.
Key Levels & Trade Plan:
Resistance:
Immediate: ~$42,850 - $42,925 (Upper flag boundary / Previous Day High).
Major: ~$43,100.
Support:
Immediate: ~$42,690 - $42,720 (Lower flag boundary).
Strong: ~$42,590.
Lower/Previous Day Low: ~$42,390 - $42,280.
Trade Plan:
Bullish Breakout (Long):
Trigger: Clear 1-hour close above $42,925 with good volume.
Target: $43,100.
Stop Loss: Below breakout level (e.g., $42,800).
Bearish Breakdown (Short):
Trigger: Clear 1-hour close below $42,690 with strong selling volume.
Target: $42,590, then $42,390.
Stop Loss: Above breakdown level (e.g., $42,750).
Dip Buy (Long):
Trigger: Price holds $42,590 or $42,280-$42,390 with bullish reversal.
Target: Resistance levels.
Stop Loss: Below the confirmed support.
Risk Management: Always use proper position sizing and set a stop loss.
If you found this analysis valuable, kindly consider boosting and following for more updates.
Disclaimer: This content is intended for educational purposes only and does not constitute financial advice.

DowJones INTRADAY important support retest Key Support and Resistance Levels
Resistance Level 1: 43190
Resistance Level 2: 43620
Resistance Level 3: 44290
Support Level 1: 42100
Support Level 2: 41420
Support Level 3: 40990
This communication is for informational purposes only and should not be viewed as any form of recommendation as to a particular course of action or as investment advice. It is not intended as an offer or solicitation for the purchase or sale of any financial instrument or as an official confirmation of any transaction. Opinions, estimates and assumptions expressed herein are made as of the date of this communication and are subject to change without notice. This communication has been prepared based upon information, including market prices, data and other information, believed to be reliable; however, Trade Nation does not warrant its completeness or accuracy. All market prices and market data contained in or attached to this communication are indicative and subject to change without notice.

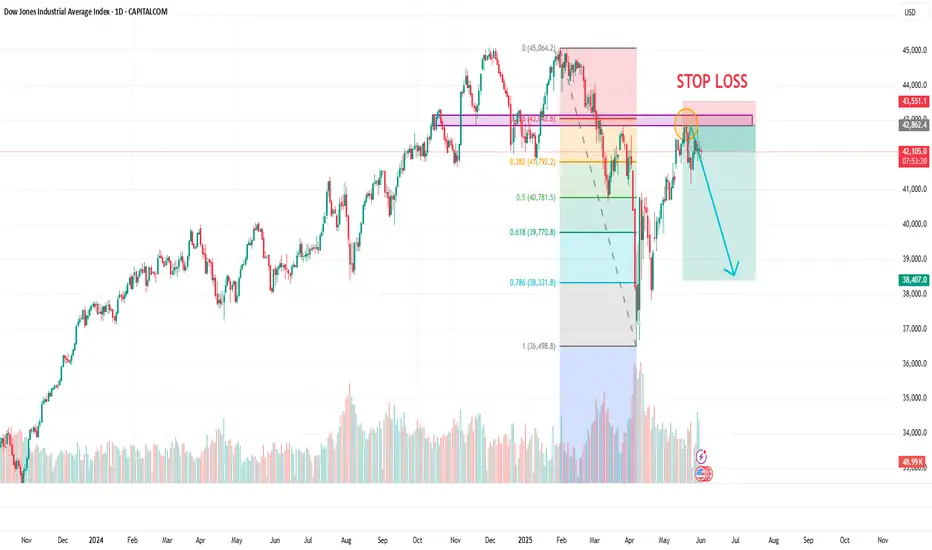
DOW JONES – Triple Rejection Alert! Is a Breakdown Coming?The DOW (DJI) is struggling hard near the 42,600 resistance zone, and signs are pointing toward a potential bearish reversal.
📊 What’s the Chart Telling Us?
Price is hovering at a strong supply zone marked by heavy volume resistance (🔵 LuxAlgo Visible Range).
After three failed attempts to break above 42,600, bears may be gearing up to strike.
Support levels at 40,557 and 38,060 are now key downside targets.
🔻 Bearish Bias Building:
Strong supply zone rejection just like we saw in late April and mid-May.
Momentum slowing while price tests the same highs = distribution phase? 🤔
Divergence between price action and buyer strength is becoming more visible.
Key U.S. data events and Fed signals (⚡🇺🇸) coming up — potential catalysts for a breakout or breakdown.
🎯 Key Levels to Watch:
42,600 = Bull trap zone? Watch for another fake breakout.
40,557 = First test support — break here confirms weakness.
38,060 = Demand zone where bulls may re-enter, or price collapses further.
---
📌 My Plan:
If price fails again at 42,600, I’ll look for short opportunities toward 40,557, and 38,060 with tight risk control.
---
💬 What do YOU think?
Is Dow Jones heading for a correction? Or are the bulls playing possum?
👉 Drop your thoughts, hit the ❤️ if this helps your analysis, and follow for updates!

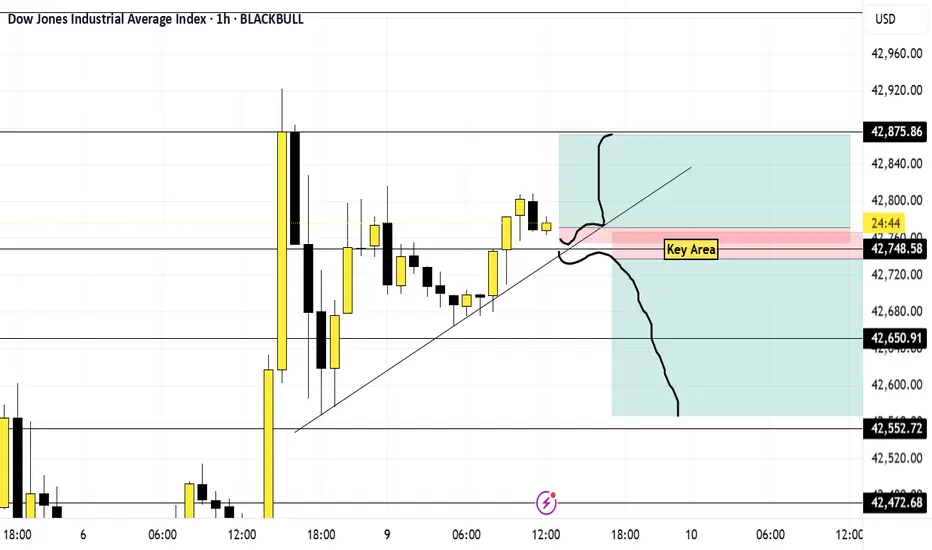
US30 JUNE 9Happy Mondays! Why are libraries so tall? Because they have many stories, like you will once you lock in on trading.
Now we can only do three things when it comes to trading Buy, Sell or nothing.
Price is moving up right now. If price breaks and retests my trend line and key area then I'm going to sell. However, if price rejects those same areas and starts to create higher highs and lows then I'll buy it.
If price decides to act like that one friend who got too high and decides to go nowhere then I shall do nothing and wait. That it that all.
Have fun and enjoy the process
DowJones uptrend retest Key Support and Resistance Levels
Resistance Level 1: 43192
Resistance Level 2: 43620
Resistance Level 3: 44290
Support Level 1: 42100
Support Level 2: 41420
Support Level 3: 40990
This communication is for informational purposes only and should not be viewed as any form of recommendation as to a particular course of action or as investment advice. It is not intended as an offer or solicitation for the purchase or sale of any financial instrument or as an official confirmation of any transaction. Opinions, estimates and assumptions expressed herein are made as of the date of this communication and are subject to change without notice. This communication has been prepared based upon information, including market prices, data and other information, believed to be reliable; however, Trade Nation does not warrant its completeness or accuracy. All market prices and market data contained in or attached to this communication are indicative and subject to change without notice.


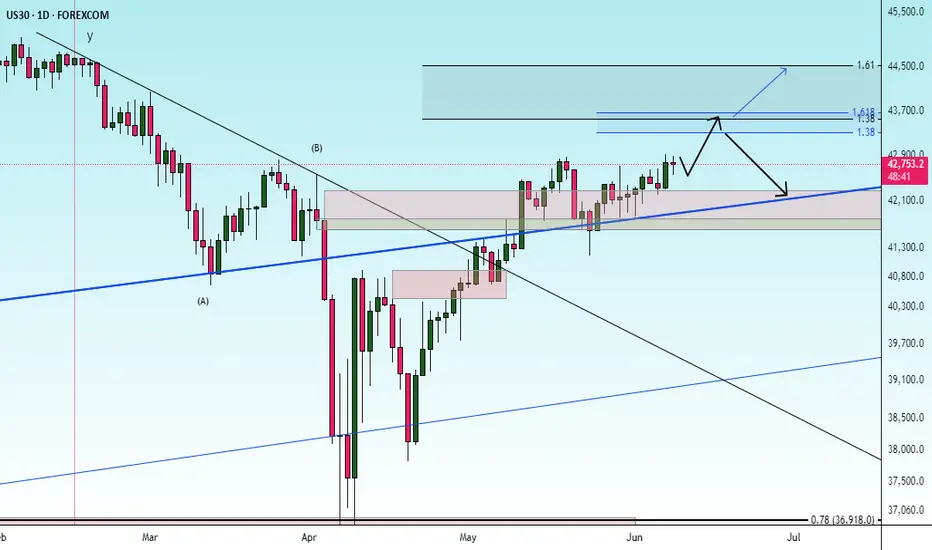
US30 Breaks Trendline Support – Will Geopolitics Add FuelUS30 (Dow Jones) — Trendline Breach & Rising Geopolitical Risk
Technical Outlook — 13 June, 2025
Current Market Condition:
US30 is currently trading at 42,339, showing early signs of risk-off sentiment following a clear break of both the ascending trendline and the Previous Day Low, with price rejecting from the 42,863 supply zone. This sharp decline aligns with growing tensions between Iran and Israel, which are weighing heavily on investor confidence. The breakdown suggests a shift in momentum, with further downside likely if key support levels fail to hold.
Key Technical Highlights:
Major ascending trendline support has broken, indicating a structural shift toward bearish sentiment.
Price broke below both the Previous Day Low (42,551) and Fib support, invalidating short-term bullish setups.
EMA 50 was lost, and price is heading toward the 200 MA at ~42,100.
Stochastic shows strong bearish momentum, currently in a downward cross and nowhere near oversold.
Major downside levels: 42,100, 41,900, 41,700, and 41,500.
Upside resistance: 42,550, followed by 42,863 and 42,970.
🌍 Geopolitical Factor – Iran-Israel Conflict:
The recent escalation between Iran and Israel has intensified risk aversion across global markets. Defensive sectors are gaining while equity indices like the Dow Jones face increased selling pressure. With concerns over possible oil supply disruptions and global uncertainty, traders are pulling capital from equities and seeking safe-haven assets like gold and bonds.
The volatility spike from this geopolitical conflict may overshadow technical setups, amplifying moves and reducing the reliability of support/resistance zones unless confirmed with volume.
Trade Plan:
🔻 1. Bearish Continuation Setup (Short Bias) – Most Probable
Trigger: Retest of 42,550 fails (previous demand turned supply)
Target: 42,100 → 41,900 → 41,500
Stop Loss: Above 42,600
⚠️ 2. Pullback Bounce (Short-term Buy) – Less Probable
Trigger: Strong bounce from 42,100 with bullish divergence on Stochastic
Target: 42,550 → 42,700
Stop Loss: Below 42,000
Risk Management Note:
Due to the unfolding Middle East conflict, markets may behave erratically and spike unpredictably. Use smaller position sizes, widen SL buffers slightly, and stay alert to news headlines. Prioritize confirmation over anticipation.
📢 If you found this analysis valuable, kindly consider boosting and following for more updates.
⚠️ Disclaimer: This content is intended for educational purposes only and does not constitute financial advice.


US30 I Bearish Reversal Based on the M30 chart, the price is rising toward our sell entry level at 42,481.32, a pullback resistance that aligns with the 38.2% Fib retracement.
Our take profit is set at 42,326.96, a pullback support that aligns closely with the 50% Fib retracement.
The stop loss is set at 42,646.90, a swing high resistance.
High Risk Investment Warning
Trading Forex/CFDs on margin carries a high level of risk and may not be suitable for all investors. Leverage can work against you.
Stratos Markets Limited (tradu.com ):
CFDs are complex instruments and come with a high risk of losing money rapidly due to leverage. 63% of retail investor accounts lose money when trading CFDs with this provider. You should consider whether you understand how CFDs work and whether you can afford to take the high risk of losing your money.
Stratos Europe Ltd (tradu.com ):
CFDs are complex instruments and come with a high risk of losing money rapidly due to leverage. 63% of retail investor accounts lose money when trading CFDs with this provider. You should consider whether you understand how CFDs work and whether you can afford to take the high risk of losing your money.
Stratos Global LLC (tradu.com ):
Losses can exceed deposits.
Please be advised that the information presented on TradingView is provided to Tradu (‘Company’, ‘we’) by a third-party provider (‘TFA Global Pte Ltd’). Please be reminded that you are solely responsible for the trading decisions on your account. There is a very high degree of risk involved in trading. Any information and/or content is intended entirely for research, educational and informational purposes only and does not constitute investment or consultation advice or investment strategy. The information is not tailored to the investment needs of any specific person and therefore does not involve a consideration of any of the investment objectives, financial situation or needs of any viewer that may receive it. Kindly also note that past performance is not a reliable indicator of future results. Actual results may differ materially from those anticipated in forward-looking or past performance statements. We assume no liability as to the accuracy or completeness of any of the information and/or content provided herein and the Company cannot be held responsible for any omission, mistake nor for any loss or damage including without limitation to any loss of profit which may arise from reliance on any information supplied by TFA Global Pte Ltd.
The speaker(s) is neither an employee, agent nor representative of Tradu and is therefore acting independently. The opinions given are their own, constitute general market commentary, and do not constitute the opinion or advice of Tradu or any form of personal or investment advice. Tradu neither endorses nor guarantees offerings of third-party speakers, nor is Tradu responsible for the content, veracity or opinions of third-party speakers, presenters or participants.


NFP Setups: Dow Breakout or USDJPY Breakdown?Big moves ahead? Friday’s Non-Farm Payrolls could be the trigger. ADP came in weak, jobless claims spiked, and ISM data disappointed. Now all eyes are on the Dow Jones and USDJPY. A strong NFP could send the Dow to new highs, while a weak one may sink USDJPY toward the 2025 low.
Watch the full breakdown and share your take in the comments.
This content is not directed to residents of the EU or UK. Any opinions, news, research, analyses, prices or other information contained on this website is provided as general market commentary and does not constitute investment advice. ThinkMarkets will not accept liability for any loss or damage including, without limitation, to any loss of profit which may arise directly or indirectly from use of or reliance on such information.

US30 – Key Resistance at 42690 Ahead of ADP-Driven VolatilityUS30
The indices market is expected to be highly volatile today due to upcoming data releases, especially the ADP employment report.
Dow Jones (US30) appears to be continuing its bullish scenario toward 42690.
A break above 42690 may push the price further toward 42810, and if momentum holds, toward 43200.
However, stability below 42690 could trigger a strong correction toward 42460.
A sustained move below the pivot line at 42570 would shift the trend to bearish.
Resistance: 42690, 42810, 43200
Support: 42460, 42260, 42080

