USA30 trading I deaHi traders is mpho again this is my trading plan for dow it's a clear set up, however fundamentals can violate set up as.we are trading under tarrrif territory but am encouraging you to stick in the trend n counter tarrif n not overthink n quickly take a decision to change the directions make sure you have confirmations before jump into any trends,as always nothing much analysis speak for it selfs more than words can,I wish you all the best 👍
Dow Jones Industrial Average Index
42,773.07USDR
−63.50−0.15%
As of today at 05:20 GMT
USD
No trades
US30 trade ideas

US30 (Dow Jones) – Major Supply Zone Rejection! 🔵 Key Zones in Focus:
42,082.00 – Major Supply Zone (price struggling here for days – exhaustion signs)
40,207.78 – Support level with potential for short-term bounce
37,757.73 – High Volume Node / Demand Zone, strong buyer reaction area from May
---
📌 Technical Breakdown:
Price is facing heavy resistance at the upper blue zone (Supply) – no breakout yet!
Multiple failed attempts to break above = distribution in progress?
Volume dropping near highs → early warning of trend exhaustion
Clean downside structure setup with two clear bearish targets
---
🎯 Trade Idea:
📉 Sell Bias unless price breaks and closes above 42,100 with volume
First Target: 40,207
Second Target: 37,757 (Demand Cluster)
---
📢 What’s your move on US30? 📊 Are you shorting this Supply Zone too or expecting a breakout?
💬 Share your setup below – let's compare strategies!
👍 Like if this was useful
🔁 Repost to help others catch this move
📈 Follow for weekly market setups & clean charts!
#US30 #DowJones #TradingView #SupplyAndDemand #BearishReversal #PriceActionTrading #VolumeProfile #SmartMoney #ForexSignals #TechnicalAnalysis #DayTrading #SwingTradeSetups


Hanzo / US30 15 Min Path ( Confirmed Bullish Reversal )🆚 US30
The Path of Precision – Hanzo’s Market tactics
🔥 Key Levels & Breakout Strategy – 30 M TF
☄️ Bullish Reversal – 42400 Zone
Price must break liquidity with high volume to confirm the move.
Reasons
Bullish After Retest
42450
1hr key level
Retest - History Of 42470
21 May / 2025
19 May / 2025
16 May / 2025
12 May / 2025


US30 JUNE 2What did the Buffalo say to his son when he left home? Bison...
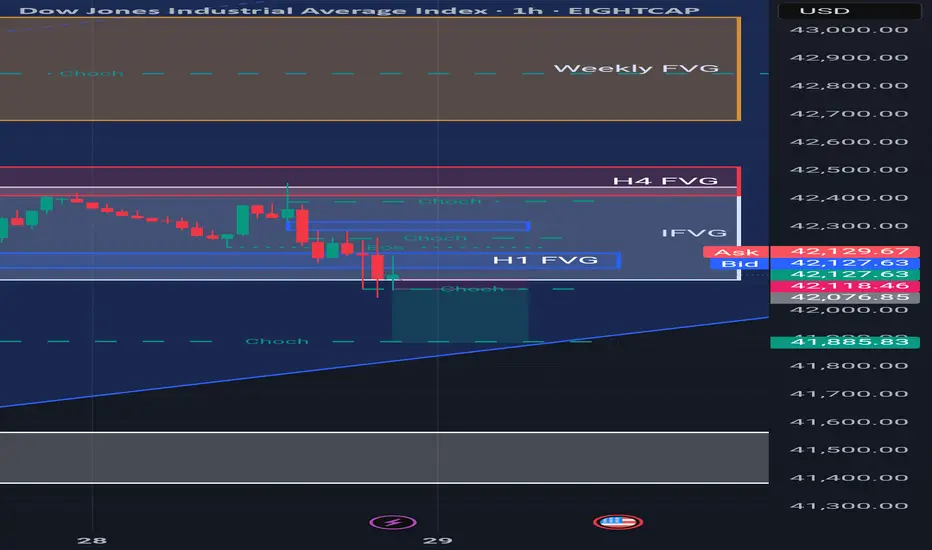
Anyway, let's get to work. Price is looking very messy. So instead of trading it I'm going to draw a box around the consolidation and wait for price to break and retest the ends of the boxes.
Like always I'll wait for the 1m for price to break and retest before I enter the trade.
NEVER Trade Consolidation, it gets messy quickly.
Anywho... Have fun trading and be patient.


Dow Jones Signals Two Key Levels for Upside Gains Targets:
- T1 = $43200
- T2 = $43800
Stop Levels:
- S1 = $41600
- S2 = $40400
**Wisdom of Professional Traders:**
This analysis synthesizes insights from thousands of professional traders and market experts, leveraging collective intelligence to identify high-probability trade setups. The wisdom of crowds principle suggests that aggregated market perspectives from experienced professionals often outperform individual forecasts, reducing cognitive biases and highlighting consensus opportunities in Dow Jones.
**Key Insights:**
Traders should watch for short-term volatility driven by mixed technical patterns and geopolitical risks. Indicators signal potential upward momentum but require confirmation near resistance zones. Medium-term sentiment remains cautious due to inflationary pressures and fiscal concerns.
**Recent Performance:**
The Dow Jones gained 1.60% last week, showcasing resilience amid uncertain global conditions. Volatility has decreased slightly but remains a key driver of short-term fluctuations. Industrial and energy sectors supported gains, while healthcare lagged behind.
**Expert Analysis:**
Short-term RSI and MACD readings suggest ongoing bullish momentum, but stochastic signals introduce caution. Geopolitical factors, particularly U.S.-China trade policy concerns and elevated bond yields, pose risks to market stability. Long-term indicators maintain more favorable sentiment.
**News Impact:**
Declining inflation eases long-term fears, while escalating trade tensions weigh on export-heavy Dow components. Key domestic events, including reduced consumer spending, reflect slowing demand in sectors like airlines and retail. Meanwhile, international market weakness dampens sentiment, particularly in Asia as the Hang Seng Index declines.
**Trading Recommendation:**
With mixed technical signals and moderate risks, a cautiously optimistic LONG position is recommended for Dow Jones. The asset is positioned for gains if price action maintains strength above $42,270. Tight stop levels ensure risk management, targeting $43,200 initially and extending to $43,800 under favorable conditions.

DOW JONES FORECAST"The guns are primed".
we expect to see heavy Bearishness from US Stock Indices today, the "dumping" price action catalyst is a heavily bullish US Dollar for reference we use Gold and US Bonds for current market conditions.
Seek Bearish profile on the 15M - 5M to trigger Bearish dealing model.

US30 Is Going Down! Short!
Please, check our technical outlook for US30.
Time Frame: 9h
Current Trend: Bearish
Sentiment: Overbought (based on 7-period RSI)
Forecast: Bearish
The price is testing a key resistance 42,213.7.
Taking into consideration the current market trend & overbought RSI, chances will be high to see a bearish movement to the downside at least to 41,560.7 level.
P.S
The term oversold refers to a condition where an asset has traded lower in price and has the potential for a price bounce.
Overbought refers to market scenarios where the instrument is traded considerably higher than its fair value. Overvaluation is caused by market sentiments when there is positive news.
Disclosure: I am part of Trade Nation's Influencer program and receive a monthly fee for using their TradingView charts in my analysis.
Like and subscribe and comment my ideas if you enjoy them!

Understanding Market StructureIn this video, I break down market structure in a simple and easy-to-digest way, helping you understand how to identify whether the market is in an uptrend or downtrend.
Recognizing market direction is a key skill for any trader, it allows you to trade in alignment with price action and make more confident, higher-probability decisions.
✅ If you're new to trading or want to sharpen your edge, this video will give you the insights needed to read market trends more clearly.
📈 Hope you find value in this breakdown!
👉 Don’t forget to like, comment, and subscribe to support the channel and stay tuned for more educational content.


US30 Falling Wedge Breakout – Bullish Reversal ConfirmedPrice formed a classic falling wedge pattern, often considered a bullish reversal signal. The breakout above resistance confirms bullish momentum.
✅ Breakout above resistance
🔁 Retest of the breakout zone near 42,100
🎯 Targeting next resistance at 42,400–42,600
🛑 Stop-loss below 42,000

US30: Will Go Down! Short!
My dear friends,
Today we will analyse US30 together☺️
The in-trend continuation seems likely as the current long-term trend appears to be strong, and price is holding below a key level of 42,126.0 So a bearish continuation seems plausible, targeting the next low. We should enter on confirmation, and place a stop-loss beyond the recent swing level.
❤️Sending you lots of Love and Hugs❤️


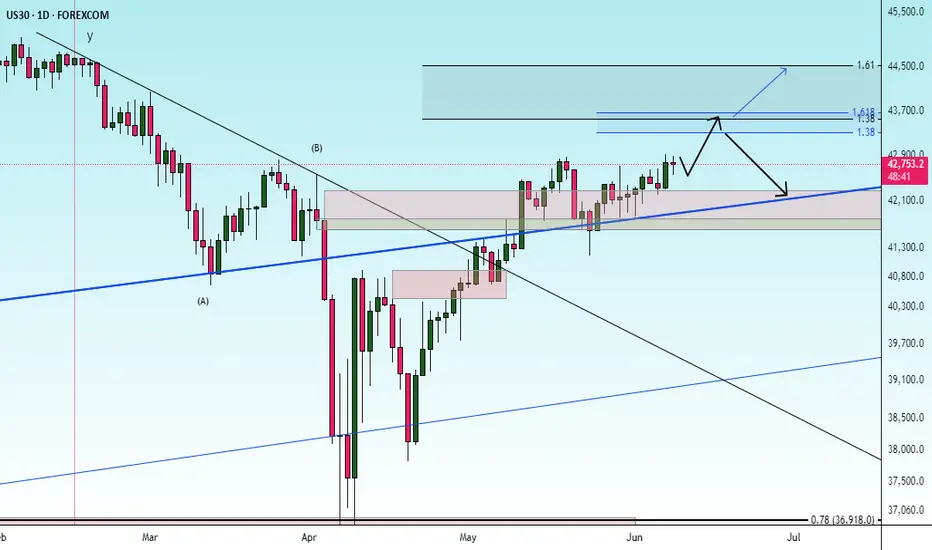
Dow Jones Continues Its Upward Momentum Toward the 43,344 Level The Dow Jones Industrial Average is showing continued bullish momentum, with an anticipated move toward the 43,344 level following a retracement to the support zone around 42,290–42,250. A price close above last week’s closing level reinforces the bullish sentiment, providing further upward momentum for the index toward the targeted levels outlined in the accompanying chart.
#Dow Jones Industrial Average
#US30
#Technical Analysis
#Chart Patterns
#Price Action
#Global Markets
#Market Outlook
#Swing Trading