Dow Jones Bullish Setup A potential bullish setup is forming on the Dow Jones Industrial,
suggesting a long opportunity upon confirmation. The trade will only activate if key validation criteria are met, targeting a 1:3 risk-reward ratio.
Dow Jones Industrial Average Index
42,192.43USDR
−713.75−1.66%
At close at Jun 13, 21:22 GMT
USD
No trades
US30 trade ideas

US30 Is Going Down! Short!
Please, check our technical outlook for US30.
Time Frame: 9h
Current Trend: Bearish
Sentiment: Overbought (based on 7-period RSI)
Forecast: Bearish
The price is testing a key resistance 42,213.7.
Taking into consideration the current market trend & overbought RSI, chances will be high to see a bearish movement to the downside at least to 41,560.7 level.
P.S
The term oversold refers to a condition where an asset has traded lower in price and has the potential for a price bounce.
Overbought refers to market scenarios where the instrument is traded considerably higher than its fair value. Overvaluation is caused by market sentiments when there is positive news.
Disclosure: I am part of Trade Nation's Influencer program and receive a monthly fee for using their TradingView charts in my analysis.
Like and subscribe and comment my ideas if you enjoy them!


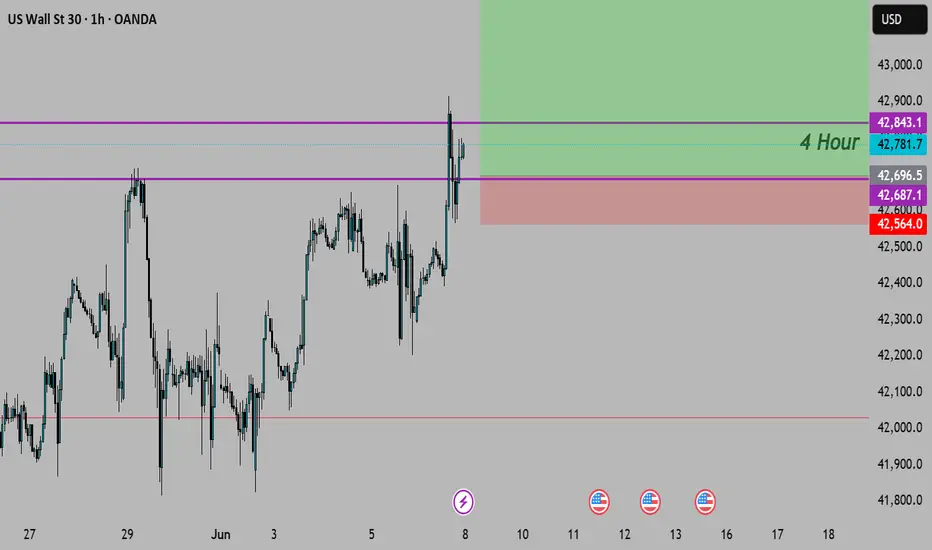
us30 outlook US30 Supply & Demand Outlook (1H–2H)
The market is currently trading within a fair value range (highlighted in yellow), with no clear edge for high-probability entries.
I'm waiting for price to move out of this range and into one of the fresh supply or demand zones marked above and below.

US30 Trade Update – 06/13/2025 🚨 US30 Trade Update – 06/13/2025 🚨
📊 Market Structure & Key Levels
US30 broke below the key support at 42,605 and continued to slide, tapping into the 42,248 demand zone. Price is currently rebounding off this level, but sellers remain in control under EMAs.
✅ Key Observations:
Failed to hold above 42,605 ❌
Strong selloff to 42,248 zone ✅
Below both EMAs → bearish pressure
📍 Key Levels:
Resistance: 42,605 → 42,793
Support: 42,248 → 41,947
🎯 Trade Plan:
🔹 Long Setup:
Buy above 42,605
→ Target: 42,793 → 43,021
🔻 Short Setup:
Breakdown below 42,248
→ Target: 41,947 → 41,894
⚠️ Market showing weakness – wait for retest or breakout to confirm next move!

US30(Dow Jones)The combination of the COT data showing a shift towards more short positions and the technical picture suggests that bearish momentum could continue. Sell/Short: Consider entering a short position at current market levels, ideally on any retracement or rally towards the resistance zone.

UJ and US30 trades - did you?📊 Triple Trade Opportunity – USDJPY & US30, 30min
This chart showcases how the ELFIEDT RSI + 3SD Reversion Strategy helps identify high-probability reversion zones with precision — even during volatile market swings. In this case, we see three clean opportunities across USDJPY and US30 that could have been traded confidently using the indicator's logic.
✅ Breakdown of the Trade Setups:
📌 1. US30 – Sell Signal at the High
As price spiked aggressively to a new high, the strategy printed a “DOWN” label:
Price extended well above the volatility band
RSI confirmed overbought momentum
Volume supported the exhaustion
📉 The market reversed shortly after and sold off heavily, offering a strong short opportunity with minimal risk.
📌 2. USDJPY – Buy Signal After Strong Decline
After a deep selloff, USDJPY printed a “UP” label at the bottom:
Price fell below the lower deviation band
RSI hit oversold levels and began turning
A bounce followed shortly after, giving traders a reversion move back toward the mean
📌 3. US30 – Second “UP” Signal After Oversold Flush
Later on the same chart, US30 printed a “UP” signal after a sharp drop. RSI was again deeply oversold, and price had reached extreme deviation from the trend baseline.
📈 The market responded with a clean reversal — an ideal intraday mean reversion setup.
🧠 How Traders Could Have Used These Setups:
Use the signal labels (“UP” and “DOWN”) to mark key reversal zones
Watch RSI for confirmation of momentum shift (rolling over or curling up)
Combine signals across related markets (e.g., USDJPY and US30) for cross-market confluence
Set stop-loss just beyond the signal wick and aim for the reversion target (like a prior zone or moving average)
📌 Key Takeaway:
These 3 setups demonstrate how your public strategy helps traders:
✔ Spot price extremes with confidence
✔ Time entries using clean RSI behavior
✔ React with logic, not emotion — even in high volatility
The ELFIEDT strategy does not predict direction — it prepares traders for where a move might fade and reverse. When used with patience and structure, it becomes a powerful tool for consistency.

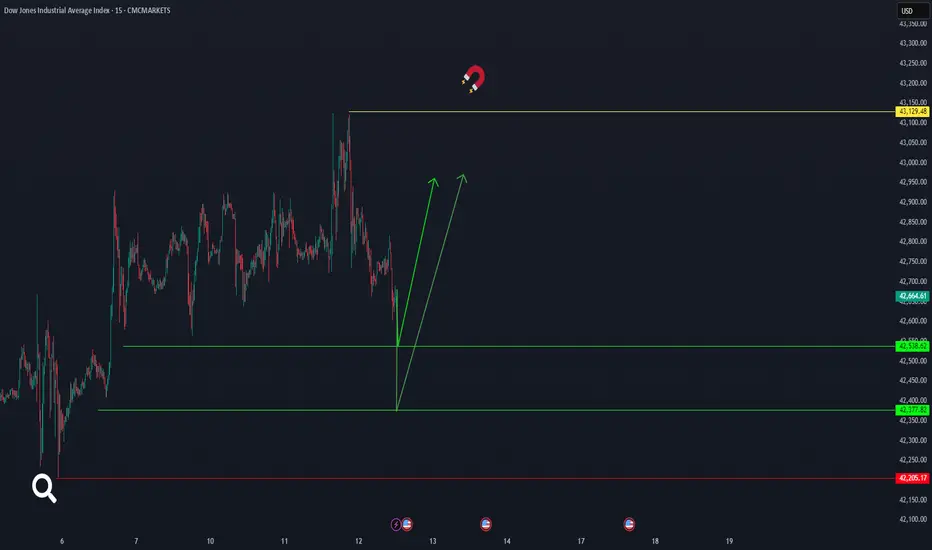
us30It seems that the Dow Jones will start moving again from the areas of 42377 or 42538 and the price will definitely reach 43129.48. Of course, the critical point is 42205. CMCMARKETS:US30
US30 Breakout Watch: 43,300 or Bust?US30 (Dow Jones) — Price Tests Key Fib Support with Breakdown Risk
Technical Outlook — 12 June, 2025
Current Market Condition:
US30 (Dow Jones Industrial Average) is currently trading around 42,661 on the 4-hour timeframe, up +0.17% for the session. After rejection at the Previous Day High (43,121), price is now pulling back and testing the Previous Day Low around the 42,660 region, which also aligns with a Fibonacci confluence zone and the 50 EMA. This zone is acting as a last line of defence for bulls — if held, a push toward new highs remains on the table. However, a confirmed break could see the index slide further toward deeper support levels.
Key Technical Highlights:
Price is testing a major fib-based support cluster around 42,600–42,700, aligning with the Previous Day Low and 50 EMA.
The Stochastic Oscillator has crossed bearish from the overbought region and is now heading down, indicating short-term bearish momentum.
Resistance is now PDL and next one at 43,121 (PDH) and a break above this level would confirm bullish continuation.
Trade Plan:
✅ 1. Bullish Breakout (Long) – Most Probable if Support Holds
Trigger: Bullish candle or engulfing pattern above 42,660–42,700 zone with volume confirmation
Target: 43,121 (PDH) → 43,300
Stop Loss: Below 42,500
⚠️ 2. Bearish Rejection (Short) – Viable if Fib Zone Breaks
Trigger: 4H candle closes below 42,600 with bearish confirmation
Target: 42,300 → 42,100 → 41,900
Stop Loss: Above 42,800
📉 3. Dip Buy Setup – Least Probable but High RR Opportunity
Trigger: Price dips into 42,100 or 41,900 zone and forms a strong bullish reversal pattern (e.g., pin bar, bullish divergence on Stochastic)
Target: Bounce back toward 42,600–42,800
Stop Loss: Below 41,800
Risk Management:
Use conservative lot sizing and set clear stop losses to avoid whipsaw risk. With macroeconomic data and news expected this week, watch for volatility spikes. Always let the setup confirm before entry, especially near fib-based support or resistance zones.
📢 If you found this analysis valuable, kindly consider boosting and following for more updates.
⚠️ Disclaimer: This content is intended for educational purposes only and does not constitute financial advice.


US30 Trade Update – 06/12/2025🚨 US30 Trade Update – 06/12/2025 🚨
📊 Market Structure & Key Levels
US30 continues to push higher after holding support at 42,610. Price tapped 43,021 resistance and is now consolidating near 42,799. Bulls are still in control, but price is sitting right below a key breakout level.
✅ Key Observations:
Strong bounce from 42,610 support ✅
Rejection seen at 43,021
Consolidation under resistance → potential breakout brewing
📍 Key Levels:
Resistance: 42,872 → 43,021
Support: 42,610 → 42,584
🎯 Trade Plan:
🔹 Long Setup:
Buy above 43,021
→ Target: New highs / intraday extensions
🔻 Short Setup:
Breakdown below 42,610
→ Target: 42,248 → 41,947
⚠️ Market is bullish but nearing exhaustion — wait for breakout confirmation or signs of reversal!

US30 Bigger Picture - Make or Break MomentUS30 H4
Technical Outlook — 11 June, 2025
Market Context:
The Dow Jones (DJI) is currently consolidating around 42,730, forming a tight range near the "Previous Day High." Price action suggests a potential ascending triangle or consolidation pattern, indicating a crucial decision point for the short-term trend. The market is showing indecision at a key resistance cluster.
Key Levels & Trade Plan:
Resistance:
Immediate: ~$42,890 - $42,950 (Previous Day High / Upper consolidation boundary).
Major: ~$43,100 - $43,150.
Support:
Immediate: ~$42,700 - $42,750 (Lower consolidation boundary / Ascending trendline).
Strong: ~$42,545 - $42,600.
Lower/Previous Day Low: ~$42,280 - $42,390.
Trade Plan:
Bullish Breakout (Long):
Trigger: Clear 1-hour close above $42,950 with good volume.
Target: $43,100.
Stop Loss: Below breakout level (e.g., $42,850).
Bearish Breakdown (Short):
Trigger: Clear 1-hour close below $42,700 with strong selling volume.
Target: $42,600, then $42,390.
Stop Loss: Above breakdown level (e.g., $42,780).
Dip Buy (Long):
Trigger: Price holds $42,545 - $42,600 with bullish reversal.
Target: Resistance levels.
Stop Loss: Below the confirmed support.
Risk Management: Always use proper position sizing and set a stop loss.
If you found this analysis valuable, kindly consider boosting and following for more updates.
Disclaimer: This content is intended for educational purposes only and does not constitute financial advice.

US30 Near Critical Resistance! | Dow Jones Technical Outlook The Dow Jones is showing clear consolidation just below a major resistance level of 42,813 after a strong bullish rally earlier this month. Price action has been relatively choppy but continues to respect support zones and the rising trendline, suggesting a larger move is brewing.
🔹 Resistance:
42,813 (currently being tested – critical breakout zone)
Watch for candle closes above this level
🔹 Support Levels:
42,403.07 (mid-level pivot, acting as short-term support)
41,756.71 (key structural support)
Rising trendline (dynamic support zone into mid-June)
---
🔥 What the Chart Tells Us:
✅ Price is compressing near resistance with higher lows
✅ Strong demand around 42,262 and 42,292 zones
✅ Upcoming U.S. economic events (circled) could be the catalyst
✅ Volume and volatility expected to increase
---
💡 Possible Trading Scenarios:
📈 Bullish Breakout Setup:
A 4H candle close above 42,813 could trigger a momentum breakout, potentially targeting 43,000+.
📉 Bearish Rejection Setup:
Failure to break above may send price back to 42,400, and if broken, down to test 41,756 or the trendline.
---
📅 Upcoming U.S. Economic Data:
🟣 Marked on chart – keep your eyes on June 11, 12, and 13 for high-impact announcements!
---
📌 My Personal Bias:
Watching for a clean breakout with strong volume confirmation above 42,813. Patience is key here!
---
💬 What do YOU think?
Will the bulls break through or are we setting up for a pullback?
📝 Drop your analysis or setups below — Let’s grow together!
👍 Like & 🔔 Follow @FrankFx14 for more market updates!
#US30 #DowJones #TechnicalAnalysis #TradingView #FrankFx14 #SupportAndResistance #BreakoutTrading #PriceAction #Forex #Indices #StockMarketAnalysis


US30: The Next Big Move? Bullish Breakout or Bearish DropUS30 Intraday Setup
Technical Outlook — 10 June, 2025
Market Context:
The Dow Jones (DJI) is currently consolidating around 42,730, hovering near the "Previous Day High" after several attempts to break higher. Price action is forming a potential ascending triangle or a tight range, suggesting a crucial decision point for the intraday trend. The market is showing indecision at key resistance.
Key Levels & Trade Plan:
Resistance:
Immediate: ~$42,890 - $42,950 (Previous Day High / Upper boundary of consolidation).
Major: ~$43,100 - $43,150.
Support:
Immediate: ~$42,700 - $42,750 (Lower boundary of consolidation / Ascending trendline).
Strong: ~$42,545 - $42,600.
Lower/Previous Day Low: ~$42,280 - $42,390.
Trade Plan:
Bullish Breakout (Long):
Trigger: Clear 1-hour close above $42,950 with good volume, confirming breakout from consolidation/Previous Day High.
Target: $43,100, then $43,150.
Stop Loss: Below breakout level (e.g., $42,850).
Bearish Breakdown (Short):
Trigger: Clear 1-hour close below $42,700 with strong selling volume, breaking the ascending trendline/consolidation.
Target: $42,600, then $42,390.
Stop Loss: Above breakdown level (e.g., $42,780).
Dip Buy (Long):
Trigger: Price holds $42,545 - $42,600 with clear bullish reversal signals (e.g., strong wick, bullish engulfing) on the 1-hour timeframe.
Target: Resistance levels.
Stop Loss: Below the confirmed support (e.g., $42,500).
Risk Management: Always use proper position sizing and set a stop loss.
If you found this analysis valuable, kindly consider boosting and following for more updates.
Disclaimer: This content is intended for educational purposes only and does not constitute financial advice.

DowJones INTRADAY support at 42100Key Support and Resistance Levels
Resistance Level 1: 43190
Resistance Level 2: 43620
Resistance Level 3: 44290
Support Level 1: 42100
Support Level 2: 41420
Support Level 3: 40990
This communication is for informational purposes only and should not be viewed as any form of recommendation as to a particular course of action or as investment advice. It is not intended as an offer or solicitation for the purchase or sale of any financial instrument or as an official confirmation of any transaction. Opinions, estimates and assumptions expressed herein are made as of the date of this communication and are subject to change without notice. This communication has been prepared based upon information, including market prices, data and other information, believed to be reliable; however, Trade Nation does not warrant its completeness or accuracy. All market prices and market data contained in or attached to this communication are indicative and subject to change without notice.

Dow Jones H1 | Overlap support at 50% Fibonacci retracementThe Dow Jones (US30) is falling towards an overlap support and could potentially bounce off this level to climb higher.
Buy entry is at 42,562.05 which is an overlap support that aligns with the 50.0% Fibonacci retracement.
Stop loss is at 42,196.55 which is a level that lies underneath a swing-low support and the 61.8% Fibonacci retracement.
Take profit is at 42,865.41 which is a multi-swing-high resistance.
High Risk Investment Warning
Trading Forex/CFDs on margin carries a high level of risk and may not be suitable for all investors. Leverage can work against you.
Stratos Markets Limited (tradu.com ):
CFDs are complex instruments and come with a high risk of losing money rapidly due to leverage. 63% of retail investor accounts lose money when trading CFDs with this provider. You should consider whether you understand how CFDs work and whether you can afford to take the high risk of losing your money.
Stratos Europe Ltd (tradu.com ):
CFDs are complex instruments and come with a high risk of losing money rapidly due to leverage. 63% of retail investor accounts lose money when trading CFDs with this provider. You should consider whether you understand how CFDs work and whether you can afford to take the high risk of losing your money.
Stratos Global LLC (tradu.com ):
Losses can exceed deposits.
Please be advised that the information presented on TradingView is provided to Tradu (‘Company’, ‘we’) by a third-party provider (‘TFA Global Pte Ltd’). Please be reminded that you are solely responsible for the trading decisions on your account. There is a very high degree of risk involved in trading. Any information and/or content is intended entirely for research, educational and informational purposes only and does not constitute investment or consultation advice or investment strategy. The information is not tailored to the investment needs of any specific person and therefore does not involve a consideration of any of the investment objectives, financial situation or needs of any viewer that may receive it. Kindly also note that past performance is not a reliable indicator of future results. Actual results may differ materially from those anticipated in forward-looking or past performance statements. We assume no liability as to the accuracy or completeness of any of the information and/or content provided herein and the Company cannot be held responsible for any omission, mistake nor for any loss or damage including without limitation to any loss of profit which may arise from reliance on any information supplied by TFA Global Pte Ltd.
The speaker(s) is neither an employee, agent nor representative of Tradu and is therefore acting independently. The opinions given are their own, constitute general market commentary, and do not constitute the opinion or advice of Tradu or any form of personal or investment advice. Tradu neither endorses nor guarantees offerings of third-party speakers, nor is Tradu responsible for the content, veracity or opinions of third-party speakers, presenters or participants.

US30 Trade Update – 06/09/2025🚨 US30 Trade Update – 06/09/2025 🚨
📊 Market Structure & Key Levels
US30 has finally broken above the prior resistance zone of 42,605, pushing toward the next key level of 42,872. Price is currently consolidating near 42,759, signaling strength but also caution as momentum pauses.
✅ Key Observations:
Clean breakout above 42,605 ✅
Next resistance: 42,872 → 43,021
Key support now: 42,605 → 42,584
🎯 Trade Plan:
🔹 Long Setup:
Buy above 42,872
→ Target: 43,021 & potential extension above
🔻 Short Setup:
Breakdown below 42,605
→ Target: 42,248 → 41,947
⚠️ Price is bullish but extended – wait for breakout or pullback confirmation!


US30 Trade Update – 06/06/2025 🚨 US30 Trade Update – 06/06/2025 🚨
📊 Market Structure & Key Levels
US30 is respecting higher support at 42,248, forming a tighter range just below 42,605 resistance. Price is hovering around 42,475, coiling up for a potential breakout. Watch closely! 🔍
✅ Key Observations:
Holding above 42,248 support
Resistance zones: 42,562 → 42,605
EMA structure bullish but stalling at highs
🎯 Trade Plan:
🔹 Long Setup:
Buy breakout above 42,605
→ Targets: 42,900 – 43,050+
🔻 Short Setup:
Breakdown below 42,248 → Confirm with 15m close
→ Targets: 41,947 – 41,894
⚠️ Price coiling under resistance – breakout incoming. Be patient, don’t chase!

US30 Trade Update – 06/05/2025🚨 US30 Trade Update – 06/05/2025 🚨
📊 Market Structure & Key Levels
US30 continues to respect bullish structure, trading above the 42,400 zone and reclaiming strength after consolidating around key support levels. Buyers are holding control with price now at 42,480+.
🔍 Key Observations:
✅ Still holding above 41,947 structure zone
✅ Higher lows intact – bullish continuation likely
🔼 Resistance in focus: 42,700 → 42,900
🎯 Trade Plan:
🔹 Long Setup:
Buy on pullbacks to 42,300–42,400
→ Target: 42,700 – 42,900
🔻 Short Setup:
Only valid on break & close below 41,947
→ Target: 41,261 – 40,983
⚠️ Trend remains bullish – follow momentum but watch for exhaustion near resistance!
