US30 Falling Wedge Breakout – Bullish Reversal ConfirmedPrice formed a classic falling wedge pattern, often considered a bullish reversal signal. The breakout above resistance confirms bullish momentum.
✅ Breakout above resistance
🔁 Retest of the breakout zone near 42,100
🎯 Targeting next resistance at 42,400–42,600
🛑 Stop-loss below 42,000
Dow Jones Industrial Average Index
42,192.43USDR
−713.75−1.66%
At close at Jun 13, 21:22 GMT
USD
No trades
US30 trade ideas

[Scalping] Long US30 (June 2, 2025)Entry was 42274.1
TP is 42298.15
SL is 42258.03
RR is 1:1.5-2
This is just record purpose with new method to trade.
Please allow this test period.
**I use only session indicator.
Other than that I do not use any indicators
New method can be used only for manual trading.


Hanzo / US30 15 Min Path ( Confirmed Bullish Reversal )🆚 US30
The Path of Precision – Hanzo’s Market tactics
🔥 Key Levels & Breakout Strategy – 30 M TF
☄️ Bullish Reversal – 42400 Zone
Price must break liquidity with high volume to confirm the move.
Reasons
Bullish After Retest
42450
1hr key level
Retest - History Of 42470
21 May / 2025
19 May / 2025
16 May / 2025
12 May / 2025

US30 Is Going Down! Short!
Please, check our technical outlook for US30.
Time Frame: 9h
Current Trend: Bearish
Sentiment: Overbought (based on 7-period RSI)
Forecast: Bearish
The price is testing a key resistance 42,213.7.
Taking into consideration the current market trend & overbought RSI, chances will be high to see a bearish movement to the downside at least to 41,560.7 level.
P.S
The term oversold refers to a condition where an asset has traded lower in price and has the potential for a price bounce.
Overbought refers to market scenarios where the instrument is traded considerably higher than its fair value. Overvaluation is caused by market sentiments when there is positive news.
Disclosure: I am part of Trade Nation's Influencer program and receive a monthly fee for using their TradingView charts in my analysis.
Like and subscribe and comment my ideas if you enjoy them!


Understanding Market StructureIn this video, I break down market structure in a simple and easy-to-digest way, helping you understand how to identify whether the market is in an uptrend or downtrend.
Recognizing market direction is a key skill for any trader, it allows you to trade in alignment with price action and make more confident, higher-probability decisions.
✅ If you're new to trading or want to sharpen your edge, this video will give you the insights needed to read market trends more clearly.
📈 Hope you find value in this breakdown!
👉 Don’t forget to like, comment, and subscribe to support the channel and stay tuned for more educational content.

US30: Will Go Down! Short!
My dear friends,
Today we will analyse US30 together☺️
The in-trend continuation seems likely as the current long-term trend appears to be strong, and price is holding below a key level of 42,126.0 So a bearish continuation seems plausible, targeting the next low. We should enter on confirmation, and place a stop-loss beyond the recent swing level.
❤️Sending you lots of Love and Hugs❤️

DowJones INTRADAY Key trading zone retestKey Support and Resistance Levels
Resistance Level 1: 42,920
Resistance Level 2: 43,300
Resistance Level 3: 43,620
Support Level 1: 41,470
Support Level 2: 41,160
Support Level 3: 40,890
This communication is for informational purposes only and should not be viewed as any form of recommendation as to a particular course of action or as investment advice. It is not intended as an offer or solicitation for the purchase or sale of any financial instrument or as an official confirmation of any transaction. Opinions, estimates and assumptions expressed herein are made as of the date of this communication and are subject to change without notice. This communication has been prepared based upon information, including market prices, data and other information, believed to be reliable; however, Trade Nation does not warrant its completeness or accuracy. All market prices and market data contained in or attached to this communication are indicative and subject to change without notice.


DOW JONES FORECAST"The guns are primed".
we expect to see heavy Bearishness from US Stock Indices today, the "dumping" price action catalyst is a heavily bullish US Dollar for reference we use Gold and US Bonds for current market conditions.
Seek Bearish profile on the 15M - 5M to trigger Bearish dealing model.


US30 Footprint Update | May 29, 2025We're witnessing a clear shift in order flow dynamics on the 1H footprint chart.
🔻 Earlier in the session, sellers were firmly in control with heavy negative delta and large sell imbalances between 42,280–42,120.
🔄 Key Change: Around 42,088–42,177, aggressive selling was absorbed, followed by a strong bullish delta of +125 and increasing buyer interest in the following candles. Volume has flipped in favor of buyers.
📈 Current Price: Holding around 42,191.50, just below the key resistance zone of 42,231. A clean break and acceptance above this level could confirm a bullish shift toward 42,280–42,300.
🧠 What I’m Watching:
Break and hold above 42,231 = long continuation
Failure to sustain = possible retest of 42,177 or lower support
🎯 Volume and delta are aligning in favor of bulls — let’s see if they can take control.


DowJones INTRADAY important resistance retest Key Support and Resistance Levels
Resistance Level 1: 42,920
Resistance Level 2: 43,300
Resistance Level 3: 43,620
Support Level 1: 41,470
Support Level 2: 41,160
Support Level 3: 40,890
This communication is for informational purposes only and should not be viewed as any form of recommendation as to a particular course of action or as investment advice. It is not intended as an offer or solicitation for the purchase or sale of any financial instrument or as an official confirmation of any transaction. Opinions, estimates and assumptions expressed herein are made as of the date of this communication and are subject to change without notice. This communication has been prepared based upon information, including market prices, data and other information, believed to be reliable; however, Trade Nation does not warrant its completeness or accuracy. All market prices and market data contained in or attached to this communication are indicative and subject to change without notice.


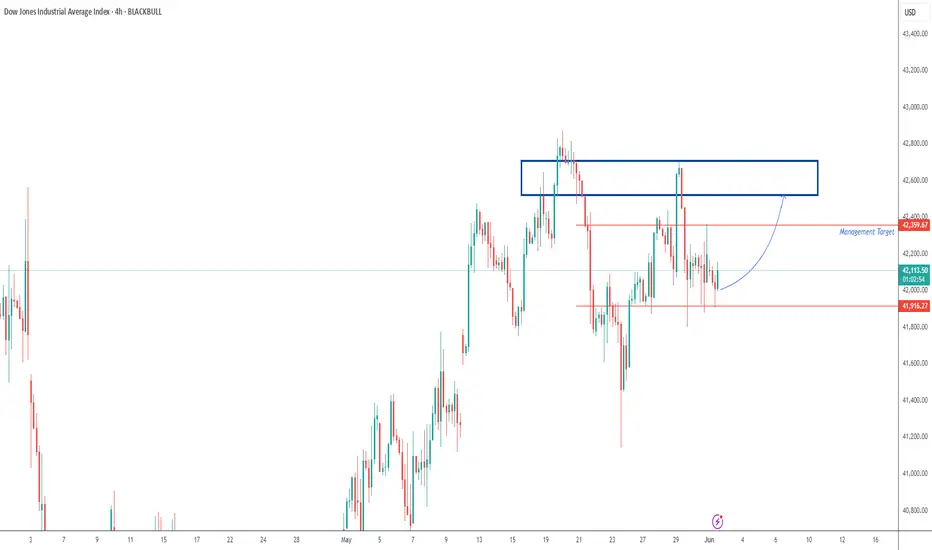
Let the Market show its hand Looking for longs in the blue box area
If no bounce a long of the lower orange point of control.
Beware the market could be in a short down trend if lower untested POC is met so i will reduce my risk and when possible protect my profits .
I will short the position if the market turns on my longs from the blue box area
