TSLA Catalysts Ranking | Q1 2026 Update | by ProjectSyndicateTSLA: Updated Outlook Jan 2026 — Catalyst Memo
Updated Catalyst Scorecard Ranked by Impact
1 🤖 Autonomous and Robotaxi Execution — 9.4
2 🧱 Energy AI and Optimus Optionality — 9.0
3 🏭 EV Demand and Geographic Mix — 7.8
4 🧮 Battery Cost and Margin Levers — 7.6
5 🗃️ Affordable Model and Next Gen P
Key facts today
Next report date
—
Report period
—
EPS estimate
—
Revenue estimate
—
1.18 USD
3.79 B USD
94.83 B USD
2.39 B
About Tesla, Inc.
Sector
Industry
CEO
Elon Reeve Musk
Website
Headquarters
Austin
Founded
2003
IPO date
Jun 29, 2010
Identifiers
3
ISIN US88160R1014
Tesla, Inc. engages in the design, development, manufacture, and sale of electric vehicles and energy generation and storage systems. The company operates through Automotive and Energy Generation and Storage. The Automotive segment includes the design, development, manufacture, sale, and lease of electric vehicles as well as sales of automotive regulatory credits. The Energy Generation and Storage segment is involved in the design, manufacture, installation, sale, and lease of stationary energy storage products and solar energy systems, and sale of solar energy systems incentives. The company was founded by Jeffrey B. Straubel, Elon Reeve Musk, Martin Eberhard, and Marc Tarpenning on July 1, 2003 and is headquartered in Austin, TX.
Related stocks

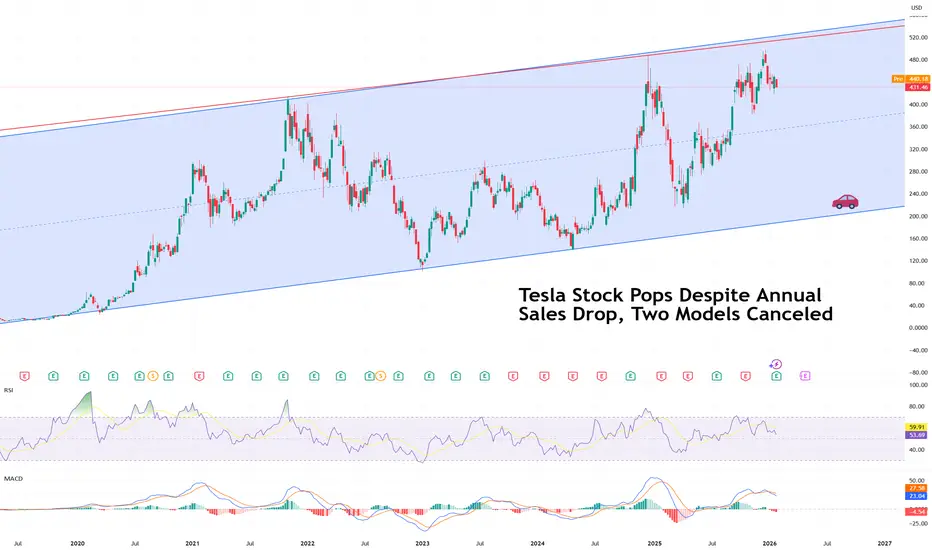
Tesla Stock Pops Despite Annual Sales Drop, Two Models CanceledTesla stock NASDAQ:TSLA managed a modest pop pre-market Thursday, rising about 3%, even as the company delivered a quarter that, on the surface, looked anything but celebratory.
Profits slid. Revenue dipped. Vehicle sales declined. Two iconic models were sent quietly into retirement. And yet, the
TESLA: Short Signal Explained
TESLA
- Classic bearish formation
- Our team expects pullback
SUGGESTED TRADE:
Swing Trade
Short TESLA
Entry - 449.13
Sl - 454.75
Tp - 438.67
Our Risk - 1%
Start protection of your profits from lower levels
Disclosure: I am part of Trade Nation's Influencer program and receive a mont

TSLA D1 Institutional Buy/Sell Levels by ProjectSyndicate 🔱 TSLA DAILY SNAPSHOT — EXECUTIVE SUMMARY (NEW WEEK | JAN 2026)
✨ Dip-accumulation reversal setup is the focus — but upside is capped until overhead sell-side is cleared
🧲 Fresh overhead sell-side liquidity / fresh supply: 495 plus key level 460
📌 Context: price is range-bound between fresh supply

$TSLA Earnings Surprise? Sub $400 perhapsWell... Hope everyone has been good since I've last seen everyone. I'm doing alright, thanks for asking. Had my first profitable year trading options and it feels fantastic. With that said, lets start the new year with a bang! I've got this bar pattern here, a direct bearish match. Invalidation with

When Price Returns to the Balance ZonePreviously, Tesla had a clear impulsive rally that pushed price into the 490–500 USD area. This was a leadership-type move, where active capital drove price decisively away from its balance zone. But like any healthy trend, the market can’t move in a straight line forever. As short-term momentum fad

TESLA New brutal Bear Cycle targets $270. 10 months ago (March 21 2025, see chart below) we made what many considered a bold buy call on Tesla (TSLA) amidst the Tariff war, which right on the market bottom. In September, our $450 long-term Target was hit:
The model was based on Tesla's previous Accumulation Phase of 2015 - 2019, which

TESLA FREE SIGNAL|
✅TESLA reacts strongly from discounted demand after liquidity sweep, forming bullish displacement. Expect continuation toward premium as imbalance fills and buy-side strength holds.
—————————
Entry: $431.55
Stop Loss: $417.14
Take Profit: $451.76
Time Frame: 4H
—————————
LONG🚀
✅Like and subscri

Tesla 4h ChartTesla (TSLA) – 4H Chart
This is a clean Head & Shoulders forming right after a long bullish run, and it’s happening exactly where it should hurt most.
What the chart is saying 👇
Left shoulder: Rejection near the highs
Head: Higher high, momentum starts fading
Right shoulder: Lower high → buyers are

TSLA Outlook : Momentum Still Favors the UpsideTesla continues to show strong price behavior, with momentum and structure still pointing higher. The move highlighted on the chart reflects controlled buying pressure and healthy continuation rather than signs of exhaustion. At this stage, the focus remains on staying aligned with the dominant flow

See all ideas
Summarizing what the indicators are suggesting.
Neutral
SellBuy
Strong sellStrong buy
Strong sellSellNeutralBuyStrong buy
Neutral
SellBuy
Strong sellStrong buy
Strong sellSellNeutralBuyStrong buy
Neutral
SellBuy
Strong sellStrong buy
Strong sellSellNeutralBuyStrong buy
An aggregate view of professional's ratings.
Neutral
SellBuy
Strong sellStrong buy
Strong sellSellNeutralBuyStrong buy
Neutral
SellBuy
Strong sellStrong buy
Strong sellSellNeutralBuyStrong buy
Neutral
SellBuy
Strong sellStrong buy
Strong sellSellNeutralBuyStrong buy
Displays a symbol's price movements over previous years to identify recurring trends.
TSLA4317805
Tesla Energy Operations, Inc. 5.45% 17-DEC-2030Yield to maturity
10.02%
Maturity date
Dec 17, 2030
TSLA4296328
Tesla Energy Operations, Inc. 5.45% 16-OCT-2030Yield to maturity
9.28%
Maturity date
Oct 16, 2030
TSLA4290558
Tesla Energy Operations, Inc. 5.45% 01-OCT-2030Yield to maturity
8.99%
Maturity date
Oct 1, 2030
TSLA4286421
Tesla Energy Operations, Inc. 5.45% 17-SEP-2030Yield to maturity
7.89%
Maturity date
Sep 17, 2030
TSLA4231716
Tesla Energy Operations, Inc. 5.45% 23-APR-2030Yield to maturity
7.60%
Maturity date
Apr 23, 2030
TSLA4250220
Tesla Energy Operations, Inc. 5.45% 29-MAY-2030Yield to maturity
7.40%
Maturity date
May 29, 2030
TSLA4313161
Tesla Energy Operations, Inc. 5.45% 03-DEC-2030Yield to maturity
7.15%
Maturity date
Dec 3, 2030
TSLA4260133
Tesla Energy Operations, Inc. 5.45% 25-JUN-2030Yield to maturity
7.02%
Maturity date
Jun 25, 2030
TSLA4247202
Tesla Energy Operations, Inc. 5.45% 21-MAY-2030Yield to maturity
6.97%
Maturity date
May 21, 2030
TSLA4224815
Tesla Energy Operations, Inc. 5.45% 26-MAR-2030Yield to maturity
6.78%
Maturity date
Mar 26, 2030
TSLA4265473
Tesla Energy Operations, Inc. 5.45% 16-JUL-2030Yield to maturity
6.72%
Maturity date
Jul 16, 2030
See all TSLA bonds
Frequently Asked Questions
The current price of TSLA is 430.41 USD — it has increased by 3.52% in the past 24 hours. Watch Tesla, Inc. stock price performance more closely on the chart.
Depending on the exchange, the stock ticker may vary. For instance, on NASDAQ exchange Tesla, Inc. stocks are traded under the ticker TSLA.
TSLA stock has fallen by −3.62% compared to the previous week, the month change is a −5.45% fall, over the last year Tesla, Inc. has showed a 4.78% increase.
We've gathered analysts' opinions on Tesla, Inc. future price: according to them, TSLA price has a max estimate of 600.00 USD and a min estimate of 43.00 USD. Watch TSLA chart and read a more detailed Tesla, Inc. stock forecast: see what analysts think of Tesla, Inc. and suggest that you do with its stocks.
TSLA reached its all-time high on Dec 22, 2025 with the price of 498.83 USD, and its all-time low was 1.00 USD and was reached on Jul 7, 2010. View more price dynamics on TSLA chart.
See other stocks reaching their highest and lowest prices.
See other stocks reaching their highest and lowest prices.
TSLA stock is 5.52% volatile and has beta coefficient of 1.66. Track Tesla, Inc. stock price on the chart and check out the list of the most volatile stocks — is Tesla, Inc. there?
Today Tesla, Inc. has the market capitalization of 1.43 T, it has decreased by −0.13% over the last week.
Yes, you can track Tesla, Inc. financials in yearly and quarterly reports right on TradingView.
Tesla, Inc. is going to release the next earnings report on Apr 28, 2026. Keep track of upcoming events with our Earnings Calendar.
TSLA earnings for the last quarter are 0.50 USD per share, whereas the estimation was 0.45 USD resulting in a 10.81% surprise. The estimated earnings for the next quarter are 0.40 USD per share. See more details about Tesla, Inc. earnings.
Tesla, Inc. revenue for the last quarter amounts to 24.90 B USD, despite the estimated figure of 24.74 B USD. In the next quarter, revenue is expected to reach 23.09 B USD.
TSLA net income for the last quarter is 840.00 M USD, while the quarter before that showed 1.37 B USD of net income which accounts for −38.82% change. Track more Tesla, Inc. financial stats to get the full picture.
No, TSLA doesn't pay any dividends to its shareholders. But don't worry, we've prepared a list of high-dividend stocks for you.
As of Jan 31, 2026, the company has 134.78 K employees. See our rating of the largest employees — is Tesla, Inc. on this list?
EBITDA measures a company's operating performance, its growth signifies an improvement in the efficiency of a company. Tesla, Inc. EBITDA is 11.00 B USD, and current EBITDA margin is 11.60%. See more stats in Tesla, Inc. financial statements.
Like other stocks, TSLA shares are traded on stock exchanges, e.g. Nasdaq, Nyse, Euronext, and the easiest way to buy them is through an online stock broker. To do this, you need to open an account and follow a broker's procedures, then start trading. You can trade Tesla, Inc. stock right from TradingView charts — choose your broker and connect to your account.
Investing in stocks requires a comprehensive research: you should carefully study all the available data, e.g. company's financials, related news, and its technical analysis. So Tesla, Inc. technincal analysis shows the sell today, and its 1 week rating is neutral. Since market conditions are prone to changes, it's worth looking a bit further into the future — according to the 1 month rating Tesla, Inc. stock shows the buy signal. See more of Tesla, Inc. technicals for a more comprehensive analysis.
If you're still not sure, try looking for inspiration in our curated watchlists.
If you're still not sure, try looking for inspiration in our curated watchlists.