very bearish on this stockabove resistance line is a breakout but overall green market is currently negative and not enough support, breakout out of the triangle, with demand zones below
WEED trade ideas


Canopy Growth rising while others are fallingCanopy Growth rising while Aurora and Aphria are falling.
This is not a good sign for WEED.

New support and resistance zones for WEEDJust a quick update today, indicating some new support and resistance zones.

Bear Flag, Measured MoveWatching for a break of the bearish rising wedge, this should eventually get back down to the old trend

Support for WEED moving up.As we can see, TSX:WEED buyer volume opened strong and we have been able to turn the previous resistance line into support, after closing 5 times above the previous line on the 4H chart. That double re-test right before this jump into the next Fibonacci zone, created some seriously heavy support and falling below that any time soon will be unlikely unless something drastic happens. We did see a bit of a dip after breaking resistance, which is usual, but right now we are just consolidating along the 61.8% retrace and holding support nicely. If we don't re-test 32.50, let's see if we can work our way up to ~34.33.

Today WEED closed at +4.20%. Not only is that hilarious, but it is a step in the right direction for sure. We tried to smoke our way past resistance, but it looks as though we couldn't quite do it, stumbling back down into the support channel. Confirmation above the MACD's on Monday will allow is to move the support up to 31.40 and possibly 31.85 if it opens bullish. That huge red shadow on the closing candle is something that we should look out for and may lead to a re-test of ~31.05, but there is some very good support as we have confirmed twice strong at that line, as you can see by my beautiful chicken scratch black circles. Hopefully it took everything the bears had to keep us blow that resistance level, and we can start to increase our positions.

WEED to break on MondayWith the tightening hourly chart, we'd expect a break of WEED by Monday of this tightening pattern. Based on the ascending triangle, I'd expect it to be a bullish break. A break of 31.85 would be the first sign, 32.52 would be major confirmation of an upward trend, and we could effectively run to 34.55 or more. The lower bar is my long-term trend bar that we've seen multiple bounces from over the past few weeks, and goes back to the start of the run in September.

Calling all BearsBig Bear Flag Forming on Weed and a Bounce off $33.00. Next week it looks like the 3rd Wave will complete downward and then we could see a big break down in the upcoming week. Upcoming Senate hearing could help or hurt.
Everyone seems to be very Bullish here I am going to sit this one out.

Time to WEED out the bears.So as we can see, there was a nice positive consolidation between the current support and resistance channel, with quite strong buyer volume all day long. This has formed somewhat of a bull flag. There is a good possibility that we will re-test resistance again, however, this is somewhat necessary to confirm the third point for a new possible upward trend line. There was zero green shadow on the closing candle, with high green volume. Tomorrow will probably push above resistance, but as I said, may not close above. If it closes into the 78.6% retrace, we will be inherently safe at 31.00.
Thanks for viewing my charts!


support has held decentlynot liking that last weekly candle too much, lets hope this symmetrical triangle breaks upwards


WEED update, bouncing off of fib. Coming down price action has bounced off of 50% from peak to peak values from the high in the 40s to the low in the 20s. Now looking with strong downward pull from bears. The retrace is almost surely over and this stock will resume its downtrend for now most likely.
How's the WEED?For a brief time we crossed resistance, but retraced and are now keeping in line with the support and resistance channel that has being tested and is currently consolidating. For the time being, the support line has been moved up, although keep an eye out or have a stop loss somewhere just below, maybe ~30.50. This is due to a slightly looming green shadow that was cast earlier this morning. Luckily it never formed a head and shoulders and held support quite nice. Hopefully this consolidation can take us in the right direction.

These WEEDs are out of control!After a brief pullback at the neckline, this Monday is showing up with some serious numbers! The support lines, as well as the downward trend line has moved up as we rocket through resistance, landing right in line with the arrow that I had indicated on the chart before last. When you approach a neck line like the one that we have just crossed, you should always be weary of a little pull back. Flying past 31.00 and almost clearing a whole retrace zone in one day, we approach new resistance, it can be anticipated that we will confirm new support when we close above, for the second time on the 4h chart. This may also be forming a head and shoulders or W pattern, where the top of the head will be will be at the resistance line. If it bounces off the next resistance hard at the 61.8% retrace, it might come down to complete that pattern, landing where the 8 day line touches support. Let's see how tomorrow plays out, if it does like it did today, it shouldn't take much to hit ~36.00.
Thank you for viewing my charts!


WEED Price Action AnalysisCurrently in consolidation within the control zone. Watch for a close above $30 to break out into an uptrend or a close below $26.12 for a break out into a down trend.

Bounced off resistance unexpectedly.Unfortunately, we didn't even close above the 0.5 re-trace, bouncing off the resistance pretty hard. Generally, closing with no shadow on a that big of a green candle would indicate an increase. There was definitely buyer volume coming in, although not quite as much as 02-05-2018, but we can see that the market opened with a giant shadow at the bottom of the candle. This indicates to me that there was most likely some whales that were waiting at that resistance/re-trace and took profit on that giant spread. I was hoping that something like that wasn't going to be the case. This is why the use of stop loss is vital, and to respect support and resistance. The Bloomberg article published yesterday that essentially called out the valuations of investors, probably didn't aide in new conviction.
I have added a new green trend line to indicate a slightly more sideways channel we are in. It is to early to determine if we are going to see a head and shoulders pattern that could take us above resistance. We are still looking good long. For now, it appears as though we may work our way down to re-test the support area, indicated by where the blue dotted lines intersect the 8 and 13 EMA's.
www.bloomberg.com
Thank you for viewing my charts!

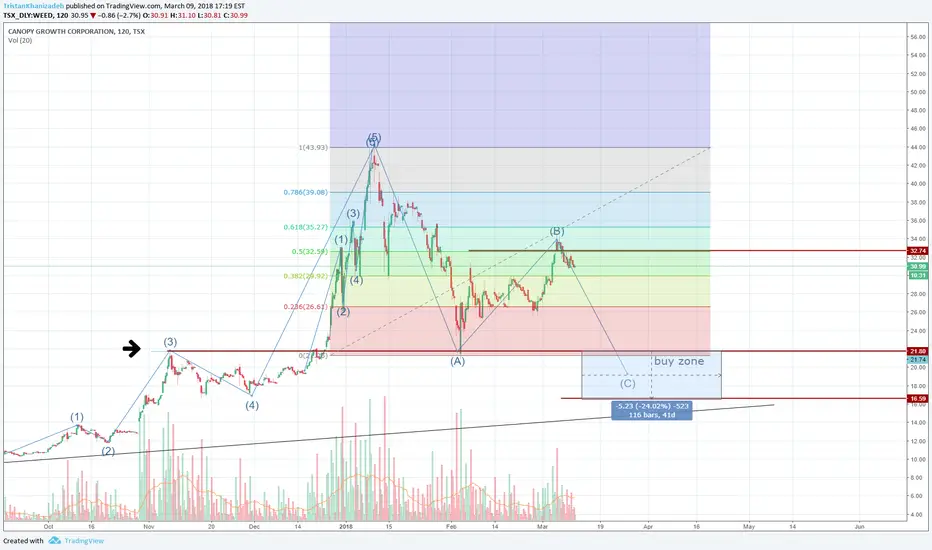
After completing a ABC and small rally, we are going lowerAfter completing a ABC correction from its All time High on the daily chart ...and having small rally from there...it looks like the whole market is heading towards at least another correction...
one the ABCDE, once price approaches or even breaches E I would go short on any pop...
TIme frame is hard to tell, but March is looking tough for the stock market as a whole.
March 2-8 may be a key dates

Don't get high on your own supply-Huge news for Tweed getting go ahead on 1.3 M sq ft greenhouses in BC
-Rec. stores in Manitoba
-Speculation of NASDAQ listing
-Increasing bullish volume on the daily chart
-Bullish MACD cross
-Could be a "laggard" to MJN??
-Currently holding WEED overnight and hoping for a significant gap up, causing RSI levels to get to extreme highs on the hourly and shorter timeframe charts. IF this happens, I'll look to sell (likely right at open) and re-buy in (looking for a possible bounce off the $30.00 lvl) using 1/5 min chart RSI indication for an oversold bounce right after exiting. Lets hope this is the start of a very nice break out to, dare I say, all time highs???

Am I seeing things?Wow 9.54%! We absolutely blew past any form of futile resistance that I thought may have held us up a bit, into the 0.5 Fibonacci re-trace zone, waiting for an almost guaranteed close tomorrow to confirm above 29.50. I'm moving the support lines up faster than I can buy. The bulls are in full force with no sign of a flag, and even though I've drawn some measly resistance that we could stagger at, the volume right now is just to massive for me to believe that we will be stopped dead at 31.00. Today closed with essentially no wick, so tomorrow, hopefully we can make it there and past. I haven't seen a breakout like this since "The Shawshank Redemption".
Thank you for viewing my charts!

Heavy resistance. New support.There is still some seriously heavy resistance that we will have to face, considering it just barely cleared above the previous, with a long green wick although. I have moved the upward trend line to reflect the newly created likely support area, indicated by the green dashed line. If we can confirm a second retest above the current dashed red resistance line, the blue support can then be moved up along with it, and new resistance will be placed at ~28.75 and 29.70. I still do believe that unless the volume comes in, it will be a struggle to break past the point where the 8 and 13 lines cross the current resistance level at 28.0. If it does go up and bounce around in that resistance channel again, it could be forming the beginning of a left shoulder of head and shoulders pattern that can hopefully break us out of the .5 Fib. retrace.
Thank you for viewing my charts!
