Key data points
No news here
Looks like there's nothing to report right now
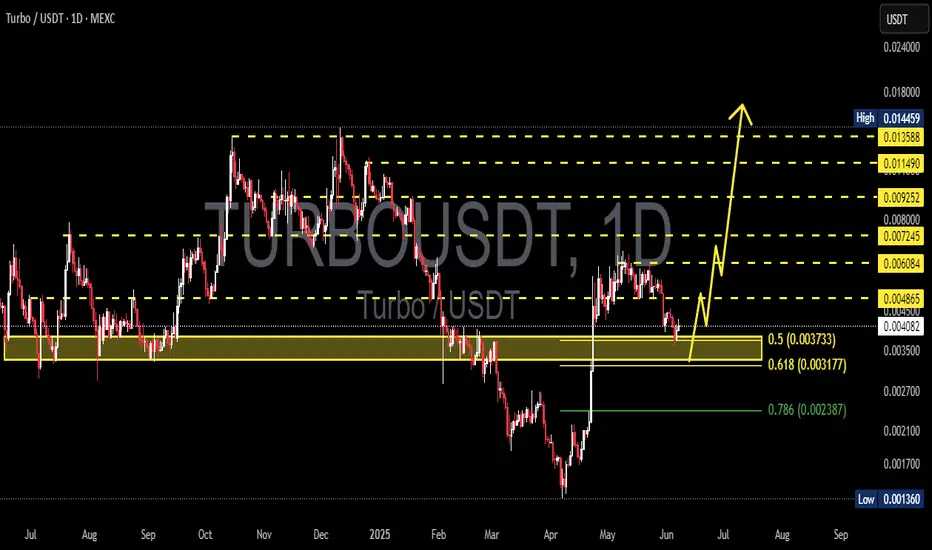
TURBOUSDT 1D#TURBO — Ready to Explode? 💥
#TURBO has formed a Megaphone Pattern on the daily chart, and a golden cross looks set to form soon — a strong bullish signal.
A breakout above the pattern resistance could trigger a massive bullish wave. If that happens, the targets are:
🎯 $0.006371
🎯 $0.007918
🎯 $0.0

TURBO ANALYSIS📊 #TURBO Analysis
✅There is a formation of Falling Wedge Pattern on daily chart and currently pullback around its major support zone🧐
Pattern signals potential bullish movement incoming after sustain above the major support zone and breaks the pattern with good volume
👀Current Price: $0.004050

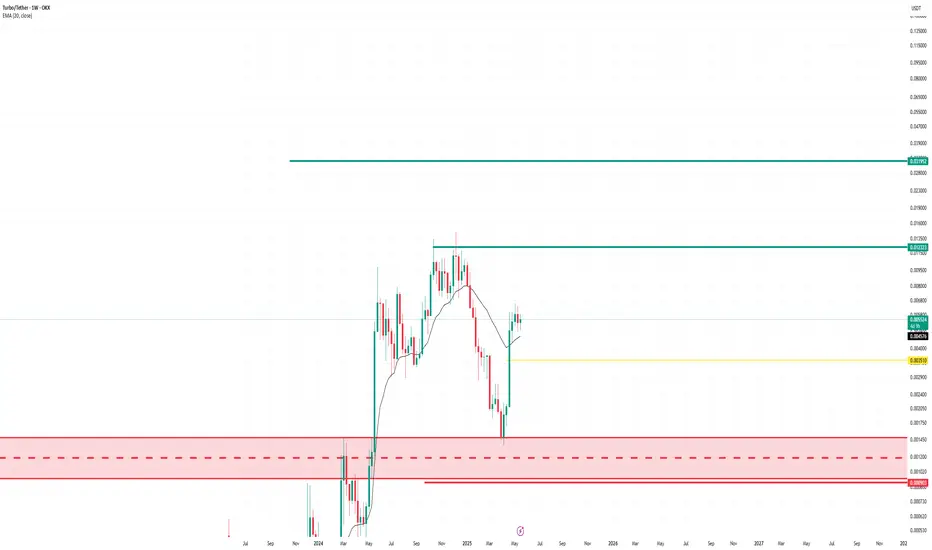
TURBOThe price may pull back and appears to be approaching a key support level around 0.003100 USDT, which was also a previous area of interest. There's an indicated potential for the price to find support within zone 0.003100 USDT and then rebound towards the 0.005600 USDT level. This suggests that whil

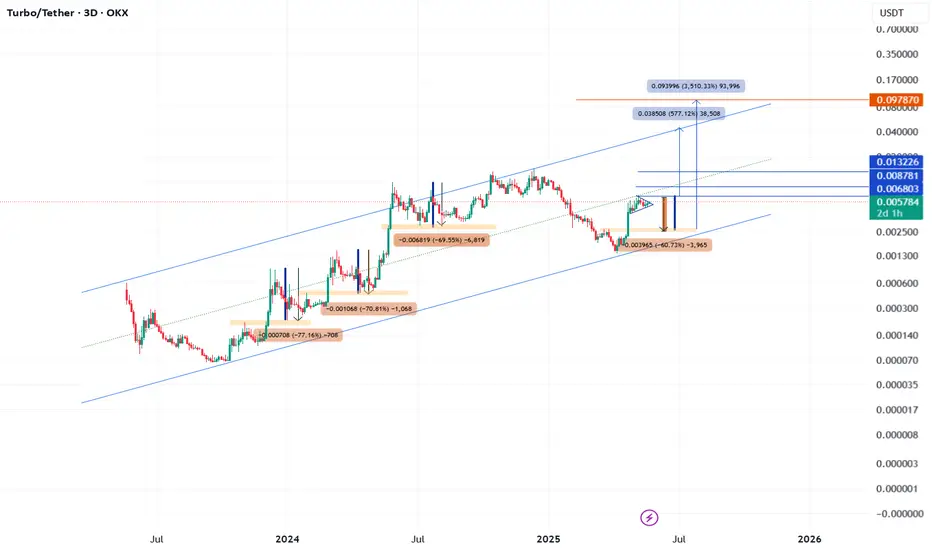
TURBO USDT UPDATE The currency is being updated, but there is a warning for those who have entered it and those who want to enter it now. If you look back at its old indicators, you'll notice that it always corrects between 65% and 70%.
I wanted to point out that if it closes weekly above 0.0061.5, we'll see the tar

#TURBO/USDT#TURBO
The price is moving within a descending channel on the 1-hour frame, adhering well to it, and is heading for a strong breakout and retest.
We are seeing a bounce from the lower boundary of the descending channel, which is support at 0.005170.
We have a downtrend on the RSI indicator that is

TURBO BEAR FLAG PATTERN - TIME TO SELLSeen here is MYX:TURBO breaking the support trendline and signal a downtrend. You may want to take profit here or pick a short position. For Turbo short,
Entry price: $0.005713
Stop loss: $0.006562
Take profit 1: 0.004845
Take profit 2: 0.003944
Take profit 3: $0.0031
Not a financial advice.

TURBOUSDT.P coin is forming a Head & Shoulder Pattern on the 1H TURBOUSDT.P coin is forming a Head & Shoulder Pattern on the 1H Time Frame.
After the chart pattern breakout, we can enter a Short Position.
According to our CGI Indicator, the 5M, 15M & 240M Time Frames are showing Bearish Tag and the 1H and 1D Charts are still showing Bullish Tag. From those two

See all ideas
Summarizing what the indicators are suggesting.
Oscillators
Neutral
SellBuy
Strong sellStrong buy
Strong sellSellNeutralBuyStrong buy
Oscillators
Neutral
SellBuy
Strong sellStrong buy
Strong sellSellNeutralBuyStrong buy
Summary
Neutral
SellBuy
Strong sellStrong buy
Strong sellSellNeutralBuyStrong buy
Summary
Neutral
SellBuy
Strong sellStrong buy
Strong sellSellNeutralBuyStrong buy
Summary
Neutral
SellBuy
Strong sellStrong buy
Strong sellSellNeutralBuyStrong buy
Moving Averages
Neutral
SellBuy
Strong sellStrong buy
Strong sellSellNeutralBuyStrong buy
Moving Averages
Neutral
SellBuy
Strong sellStrong buy
Strong sellSellNeutralBuyStrong buy
Displays a symbol's price movements over previous years to identify recurring trends.