Dow Jones Industrial Average Index
44,632.99USDR
−204.57−0.46%
At close at Jul 29, 21:54 GMT
USD
No trades
Dow Jones Industrial Average Index forum
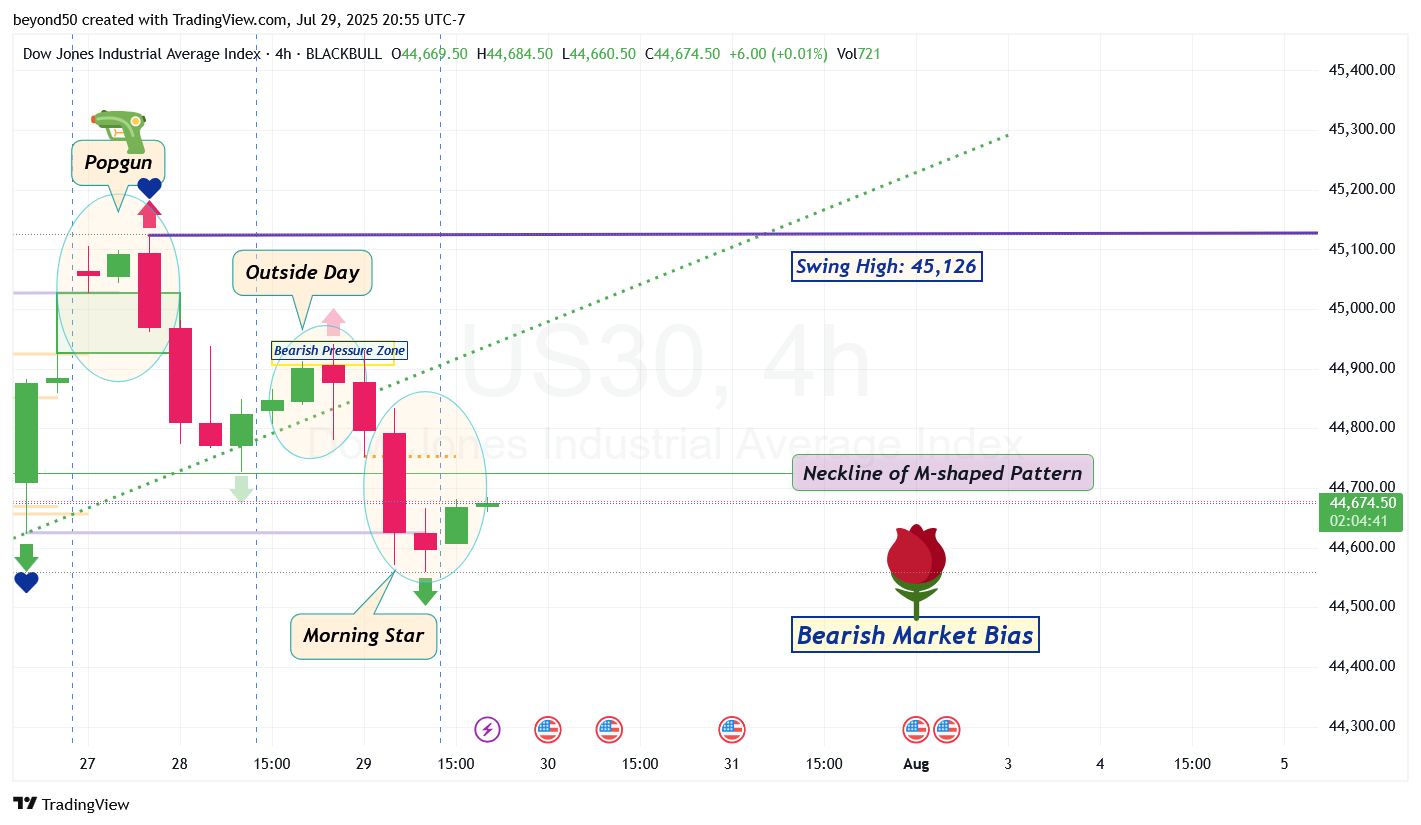
US30 swept ath, broke the Bullish 4h trend, market structure shift to the downside on the 4h. It's now in a state of retracement potentially to 44, 840 to 44, 880. I would sell from there for a further leg down, don't think it will test ath again for the next few days.. I'd probably be looking to sell from the price point.
US30 My Last Call for This Session:
A new S&R Zone formed from consolidation and the bears are dropping from it. This Zone may have blocked the bulls from a proper retrace. We'll see if the bulls will even try to rise above this S&R Zone.
A continued bearish move to the downside can potentially be toward another S&R Zone below that starts at 44.401.
*Side Note:
A Popgun pattern formed earlier during consolidation, which means that we'll see 3 major swings that will create complex consolidation that moves like a See-Saw. Here's the sequence of swings: Down-Up-Down.
So when this bearish move to the downside is over, we'll see a pivot to the upside for a bullish rally next.

US30F buy confirmed
US30F do not buy until 15min candle closes above 44795 enter the zone on retest
US30 What to Watch For:
On the Hourly, many don't know if there's more to the drop or a pullback coming.
Here's some signs of a coming pullback:
- Rejection of the low of the Inside Day at 44,589 with the lower wick of a bearish candle (shown as an orange line). That means no breakout from that price level, so going up for a breakout at the high of the Inside Day at 44,705 (shown as an orange line).
- A non-trending candle(s) forms with a real body (that creates the open and close of the candle) that's less than half the width of the whole candle;
- A bottom reversal pattern shows up;
- Heikin Ashi candle forms an upper wick (or more than one candle forms an upper wick).
- A new S&R Zone is created from consolidation for the bulls to rise above;
- Or, a Bullish Pressure Zone forms.

US30F take profit at 44985 don’t be greedy
US30F wait for the 15min candle to close above 44795 to buy
US30F don’t buy yet your SL is going to get hit retailers are not that smart